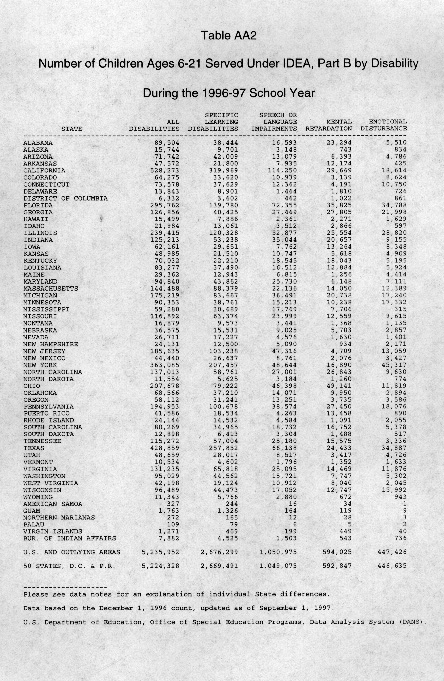
This data table shows the number of students served in special education settings by disability categories. The headers (which are difficulty to read) are:
A summary row at the bottom reports the total number of children served in each disability category
Source: 20th Annual Report to Congress on the Implementation of IDEA