|
|
|
|||
|
|
|
|
|
|
|
|
|
|
|
|
|
|
|
|
|
|
|
|
|
|
|
|
|
|
|
|
|
|
|
|
|
|
|
|
|
|
|
|
|
|
|
|
|
|
|
|
|
|
|
|
|
|
|
|
|
|
|
|
|
|
|
|
|
|
|
|
|
|
|
|
|
|
|
|
|
|
|
|
|
|
|
|
|
|
|
|
|
|
|
|
|
|
|
|
|
|
|
|
|
|
|
|
|
|
|
|
|
|
|
|
|
|
|
|
|
|
|
|
|
|
|
|
|
|
|
|
|
|
|
|
|
|
|
|
|
|
|
|
|
|
|
|
|
|
|
|
|
|
|
|
|
|
|
|
|
|
|
|
|
|
|
|
|
|
|
|
|
|
|
|
|
|
|
|
|
|
|
|
|
|
|
|
|
|
|
|
|
|
|
|
|
|
|
|
|
|
|
|
|
|
|
|
|
|
|
|
|
|
|
|
|
|
|
|
|
|
|
|
|
|
|
|
|
|
|
|
|
|
|
|
|
|
|
|
|
|
|
|
|
|
|
|
|
|
|
|
|
|
|
|
|
|
|
|
|
|
|
|
|
|
|
|
|
|
|
|
|
|
|
|
|
|
|
|
|
|
|
|
|
|
|
|
|
|
|
|
|
|
|
|
|
|
|
|
|
|
|
|
|
|
|
|
|
|
|
|
|
|
|
|
|
|
|
|
|
|
|
|
|
|
|
|
|
|
|
|
|
|
|
|
|
|
|
|
|
|
|
|
|
|
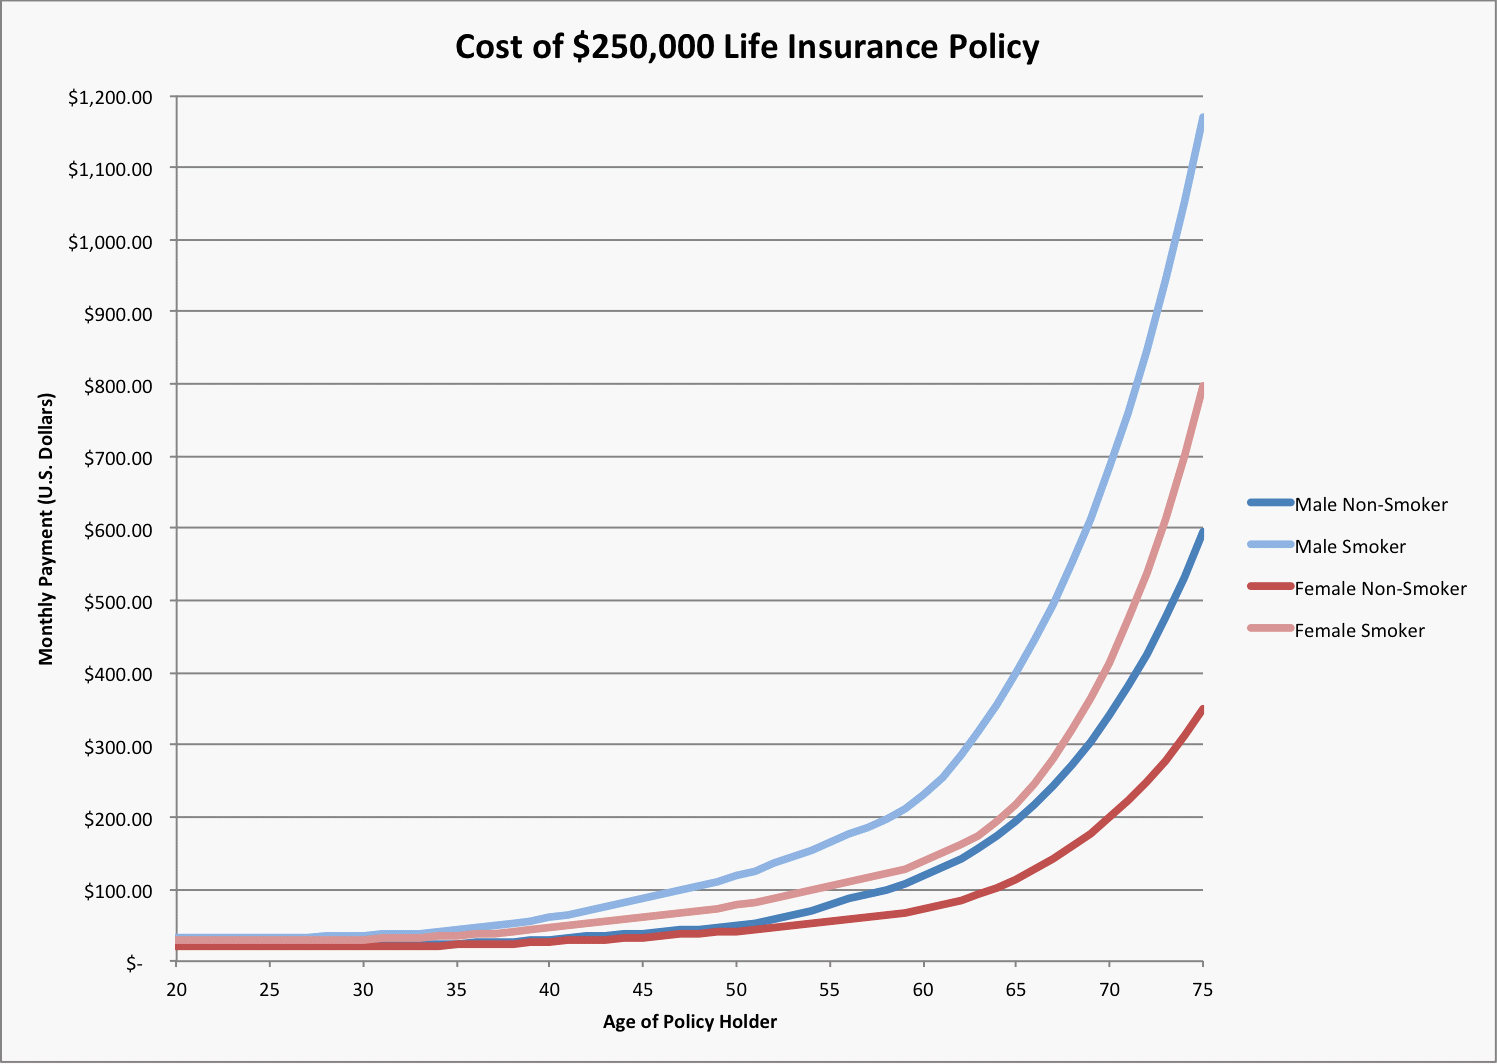
Rarely can we say anything about particular individuals, but a statistician for an insurance company can give you a pretty good estimate. When you should die, assuming you don't have an unfortunate accident, is based on the averages, and can be estimated pretty reliably by asking you a few basic "lifestyle" questions, such as your age, how much you weigh, whether or not you exercise, whether or not you smoke, how many alcoholic drinks you have per day, how many traffic tickets you have gotten in the last 5 years, how far you drive each day, whether you have a family history of heart disease or cancer, etc. Demographic data is information that relates to the ages of people, and their age distributions, within a population. That includes birth and death rates and risk factors for large groups of individuals of the same age (such a group is called a cohort). Insurance policies track demographic data very carefully because they are in the business of paying out large sums of money to the families of people who die "before their time". The following data was copied from a major life insurance company's coverage offer. These rates were offered without asking any questions about you. Presumably you could do better if you are low risk. Note, though, that they do have different (higher) rates for tobacco users. Hmmm. What does that tell us?
Use the data table and graph of insurance policy rates to answer the questions below. Download the data in Excel format.
|
|
|
|||
|
|
|
|
|
|
|
|
|
|
|
|
|
|
|
|
|
|
|
|
|
|
|
|
|
|
|
|
|
|
|
|
|
|
|
|
|
|
|
|
|
|
|
|
|
|
|
|
|
|
|
|
|
|
|
|
|
|
|
|
|
|
|
|
|
|
|
|
|
|
|
|
|
|
|
|
|
|
|
|
|
|
|
|
|
|
|
|
|
|
|
|
|
|
|
|
|
|
|
|
|
|
|
|
|
|
|
|
|
|
|
|
|
|
|
|
|
|
|
|
|
|
|
|
|
|
|
|
|
|
|
|
|
|
|
|
|
|
|
|
|
|
|
|
|
|
|
|
|
|
|
|
|
|
|
|
|
|
|
|
|
|
|
|
|
|
|
|
|
|
|
|
|
|
|
|
|
|
|
|
|
|
|
|
|
|
|
|
|
|
|
|
|
|
|
|
|
|
|
|
|
|
|
|
|
|
|
|
|
|
|
|
|
|
|
|
|
|
|
|
|
|
|
|
|
|
|
|
|
|
|
|
|
|
|
|
|
|
|
|
|
|
|
|
|
|
|
|
|
|
|
|
|
|
|
|
|
|
|
|
|
|
|
|
|
|
|
|
|
|
|
|
|
|
|
|
|
|
|
|
|
|
|
|
|
|
|
|
|
|
|
|
|
|
|
|
|
|
|
|
|
|
|
|
|
|
|
|
|
|
|
|
|
|
|
|
|
|
|
|
|
|
|
|
|
|
|
|
|
|
|
|
|
|
|
|
|
|
|
|
|
|
Questions:
1. Based on the data, rank the life expectancies (longest life=1, shortest =4) of smoking and non-smoking men and women.
2. At what age does the probability of death for non-smoking men and non-smoking women start to diverge?
3. From age 20-50, a non-smoking man's probability of death is most like that of which other group's? _________________
4. From age 50-65, describe what happens to a non-smoking male's probability of death compared to a smoking female's.
5. Even at age 20, the monthly payments for smokers are 30% higher than for non-smokers. What does this indicate?
6. From age 20-25, the monthly premium does not increase for any group. Why not?
7. At what age does it cost a man twice as much money per month to be a smoker? ____
8. At what age does it cost a woman twice as much to be a smoker? ____ Why the difference?
9. At age 75, draw a horizontal line back from the non-smoking woman's line to the smoking woman's line. Now drop that line vertically. Subtract the number you get from 75. This is an estimate of how many years smoking reduces lifespan. Do the same for the men. What do you find?
10. At age 75, draw a horizontal line back from the non-smoking woman's line to the non-smoking man's line. Now drop that line vertically. Subtract the number you get from 75. This is an estimate of how many years longer a woman is expected to live than a man. Do the same for the smokers. What do you find?