Osmosis Lab
Introduction: Human blood, at 0.9% salt concentration, is a little less salty than
seawater, which has a salt concentration of about 35 parts per thousand (3.5%). If we take seawater as an example of a solution, the salt is called the solute (the particles that are dissolved) and the water is the solvent (the liquid that dissolves the particles).
Osmosis is the movement of a solvent across a semi-permeable membrane from an area of lower solute concentration to an area of higher solute concentration. The water (the solvent) can move across the membrane but the dissolved solutes (the sodium and chloride ions that form salt) cannot. In such situations, water will move across the membrane to balance the concentration of the solutes on both sides. Cells tend to lose water (their solvent) in
hypertonic environments (where there are more solutes outside than inside the cell) and gain water in hypotonic environments (where there are fewer solutes outside than inside the cell). When solute concentrations are the same on both sides of the cell, there is no net water movement, and the cell is said to be in an isotonic environment. In this lab we will test samples of potato tissue to see how much water they absorb or release in salt solutions of varying concentrations. This gives us an indirect way to measure the osmotic concentration within living cells.
Hypo=under, iso=equal, hyper=over

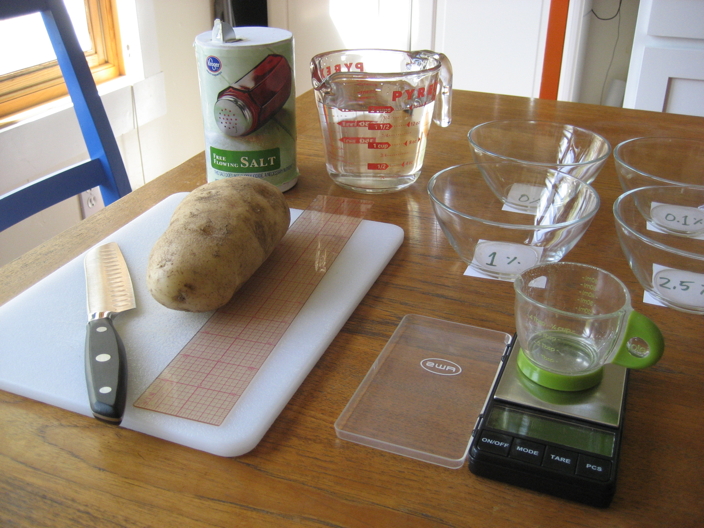
- electronic balance (0.01 g range)
- metric ruler with mm scale
- metric measuring cups
- 6 cereal bowls or shallow pans
- a small piece of raw potato to cut into six ~5 mm cubes
 (this square is 5 x 5 mm)
- single edged razor or knife
- paper towels
- watch or clock
- table salt, distilled or tap water
- 6 beakers (250 ml or larger) or cups
Methods:
- Pre-mix 6 beakers of salt solutions (0%, 0.1%, 0.5%, 1%, 2.5%, 5%) in distilled water. You can use this solution calculator to help you make your solutions. Just enter the water volume of your container and the percentage of salt you want and it will tell you how many grams of salt to add. A 1% salt solution is 1 part salt to 100 parts water. To make a 1% salt solution, you could use a 100 ml bottle, add exactly 1 gram of salt (use your electronic balance) to your bottle, and bring the water volume up to 100 ml. To make a 0.1% solution, add 1 gram of salt to 1000 ml of water (or add 0.1 g salt to 100 ml of water). If you have more water than you need, just stir well and then discard the excess.
- Prepare six small potato cubes with no skin that are all about equal in size (approximately 5 millimeters in length, width and height) and blot them dry on a paper towel. (Blot means just gently remove the surface water; no need to squeeze them!)
- Mass (weigh) each to the nearest 0.01 grams, keeping them separate, and record each initial mass in Table 1. Don't wait too long before putting them into the solutions, as evaporation will occur.
- Fill each bowl with one of the 6 stock solutions, keeping track of which is which! Label them. You won't be able to tell the salinity just by looking. Note which potato piece went into which bowl.
- Leave one of the potato slices in each of the salt solutions for up to 24 hours so that they may gain (or lose) water by osmosis. (Keep them all in the salt water the same amount of time--leaving them overnight is likely to give the best results).
- Remove the slices, blot them dry on a paper towel, carefully re-weigh them and record in the data table as final mass.
Click here to go to the calculator page, and thanks to the University of Oklahoma for this useful tool!
Results:
1. Record your actual results in a table like this one:
|
Table 1
|
% Salt |
Intitial Mass |
Final Mass |
Mass Change (g)
|
| Sample 1 |
0.0% |
|
|
|
| Sample 2 |
0.1% |
|
|
|
| Sample 3 |
0.5% |
|
|
|
| Sample 4 |
1.0% |
|
|
|
| Sample 5 |
2.5% |
|
|
|
| Sample 6 |
5.0% |
|
|
|
Table 1: Changes in potato mass as a result of immersion in salt solutions.
2. Prepare a graph showing change in mass as a function of % salt. Scale the x-axis of your graph in units of 0.5 percent. The y-axis has a zero line half way up, indicating whether the samples lost or gained weight. You will have to scale the y-axis according to your greatest and smallest changes in mass. Download this
 Excel spreadsheet
 if you need help making a graph.
Figure 1: Change in mass of potato (g) due to water gain/loss as a function of salt concentration.
3. When completed, use a ruler to draw a straight
line of best fit through your six data points, or use the computer to graph your data and calculate the line of best fit. Where the line of best fit crosses the horizontal zero line, draw a vertical line down to the x-axis. This is the point at which the potato is
isotonic with its surroundings, and is therefore the estimated salt concentration of the potato.
Questions:
- Why did some potato samples gain water and others lose water? Was there any pattern?
- When you drew the best fit line through your data and dropped the vertical line to the x-axis, what salt concentration did you obtain (Estimate if it is between numbers)? What does this mean for the potato?
- Why can't we use seawater to irrigate our crops?
- What happens when a thirsty person drinks salt water to try to quench their thirst?
- Why does salted popcorn dry your lips?
- What happens to a cell's water when the exterior liquid is saltier than its interior?
- What happens to water outside the cell when the interior is saltier than its surroundings?
- When a cell gains water, what happens to its size and weight?
- When a cell loses water, what happens to its size and weight?
- When you put limp celery stalks in water, they firm up. Why?
- Challenge question: Saltwater fish are hypotonic (less salty) to their surroundings while freshwater fish are hypertonic (more salty) to their surroundings. Assuming the salt can't move, what must each fish do with its fluids in order to compensate for the difference in salinity between the body and the surrounding environment?