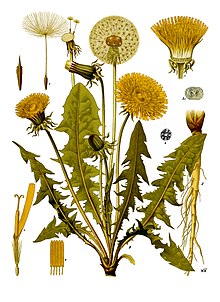
The common dandelion
Ecology is sometimes defined as a measure of the distribution and abundance of organisms. With slow moving or non-moving organisms, the quadrat survey technique can be effective. A survey is a sample of a larger population. It would not be practical to count every organism, but if we can assume that the sample is representative of the larger population, then it can be a useful estimate.
Things you'll need for this project:
Grid Survey: Let's say we want to estimate the number of dandelions in a vacant lot. We will set up a square 10 meter by 10 meter grid (100 square meters) and count all of the dandelions in ten randomly selected one-meter squares, called quadrats.
Optional for Overachievers: Using a plant identification guide, identify and count the number of individual plants of each species in each of the quadrats. This data can later be used to do a species diversity calculation.
Humans aren't good at sampling randomly, so we're going to let Microsoft Excel pick our sample locations. Download this excel spreadsheet ![]() and print out the randomly assigned sample grid it generates. (Note: since Excel is randomizing the sample grid locations, you may get incomplete or complete overlaps. If so, you'll have to decide how you want to handle that issue. Just be consistent.) Here's an example:
and print out the randomly assigned sample grid it generates. (Note: since Excel is randomizing the sample grid locations, you may get incomplete or complete overlaps. If so, you'll have to decide how you want to handle that issue. Just be consistent.) Here's an example:
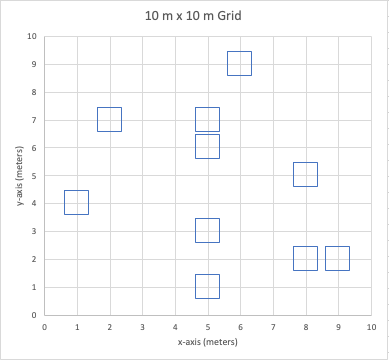
Random sampling within a 10 m x 10 m grid.
Out in the field, our vacant lot, use the tent stakes as the corners of your 10 x 10 grid, and run out the twine between the stakes, marking each meter with a piece of flagging tape. Next, find the center of each sample grid, being careful not to trample this area, and mark it off with popsicle sticks and twine. Identify each quadrat with a label, Q1 through Q10, and count the number of dandelions within the sample area. For plants on the border of the quadrat, only count them if the center of the plant falls within the sample area. Record your data.
Transect Survey: Perhaps, instead of a grid, we want to ask a question about the distribution and abundance of dandelions with respect to distance from a roadside, or elevation on a hillside, or along the side of a stream or hiking trail. In that case, a transect, or line survey may be more informative. We might still want to randomize our sampling to avoid bias, or we could decide to sample every 10 meters along the 100 m line. The approach we choose depends a bit on the question we're trying to answer. Whatever you decide, just be consistent, document your methods, and be prepared to justify the decisions you made about the sampling method. Here's an example of random samples along the transect line:

Random sampling along a 100 m transect.
Data Analysis:
| Data Analysis | Number of Dandelions |
| Q1 | 4 |
| Q2 | 3 |
| Q3 | 0 |
| Q4 | 12 |
| Q5 | 4 |
| Q6 | 6 |
| Q7 | 7 |
| Q8 | 9 |
| Q9 | 5 |
| Q10 | 8 |
| Sum | 58 |
| Average (Mean) | 5.8 |
| Standard Deviation | 3.39280284 |
| 95% Confidence Interval | 2.10284235 |
From our example data set, we can estimate that there are approximately 580 dandelions in the 100 sq meter grid, assuming that our random samples are representative of the larger area. However, because the standard deviation is high relative to the average, our estimate could be over or under by a substantial amount. A better way of stating it would be that in any randomly selected grid, we predict that the number of dandelions will be 5.8 plus or minus 2.1 (3.7 to 7.9 dandelions) with a confidence of 95% (we expect to be within this range 95% of the time).
Optional for Overachievers: If you have the time, run this experiment two more times, and compare your results to assess the validity of the original estimate.