Introduction to General Chemistry I Laboratory
General Chemistry I Laboratory (CHM151L) is designed to be taken by students enrolled in General Chemistry I Lecture (CHM151). The laboratory and lecture are separate courses and you will be assigned a separate grade for each. CHM151L will often reinforce lecture course topics covering them at the same time or after but the primary purpose is to provide you with instruction in common laboratory manipulations, laboratory safety, data collection and interpretation, record keeping, and common chemical concepts and calculations. You will become familiar with some of the chemist's basic laboratory equipment and will learn why and when this equipment is used.
Mastery of the techniques, concepts, and calculations covered in the laboratory course will provide the foundation for future chemistry and science courses and future work and thinking after the university experience. Key techniques such as mass measurement, volume transfer, solution preparation and dilution, titration, and qualitative analysis must be done safely balancing precision and speed. Concepts must then be applied to collected data to calculate final results using unit cancellation (dimensional analysis) and determine the quality or precision of the data expressed using proper significant figures, graphical analysis, and statistics. Mastery of technique is done by “doing” so nearly all the work in this course is done individually. To excel in this laboratory course you must demonstrate mastery of all the key techniques and related concepts and calculations.
The data and results for each experiment are placed on a “report sheet” provided at the end of each experiment and will be evaluated to determine if techniques, concepts, and calculations have been mastered. Unknowns are used for each experiment to assist in the evaluation process. Each unknown has a unique number to be used only by you that must be recorded correctly on the report sheet. If you use the equipment properly, record observations accurately, and calculate correctly, you will obtain an "acceptable" answer (close to the true value) and receive a PASS. On the other hand, if an "acceptable" answer is not reported, you will receive a PARTIAL CREDIT or a REPEAT. If you make technique or calculation errors while doing the experiment you most likely will not get a "PASS". Calculation checks are available for most experiments to verify that computations are done correctly, but you will only know if the experiment techniques were done correctly when the value for your unknown is graded. An "acceptable" answer for an unknown is one that correctly identifies it or comes within a range of possible answers obtained by students who carefully analyzed a sample of your unknown using the same procedures and equipment that you will use to determine a value. For best results, relax and work carefully.
You may repeat the unknown for an experiment any number of times to obtain the PASS grade (as lab space and time allows), but be sure to use a new unknown and a new report sheet each time you repeat an experiment. Staple the old report sheet to the back of the current one. If you have to repeat an experiment, get help from your teaching assistant or instructor and have them check your technique. Save all graded unknown report sheets in case there are problems and record your results and unknown number in the space provided at the end of each experiment (before the report sheet) or make a backup copy of the report sheet before turning in your results. Lost work is the student’s responsibility.
Each experiment will have pre and post lab work that will be turned in as part of the report sheet or will be done via a web based system. Your pre lab preparation for each experiment will be tested by a pre lab quiz and overall course mastery by a lab practical.
Learning Objectives
I. Technique - Laboratory Procedures and Equipment
A. The proper use of equipment for the measurement of various physical properties is very important. Considering the ease and speed of use and the desired precision and accuracy, you must be able to choose the right piece of equipment and follow proper technique to use it. This may include interpolation and estimating between the marks on a scale; using appropriate number of significant figures in reporting measured quantities. Mastery of the following techniques is expected:
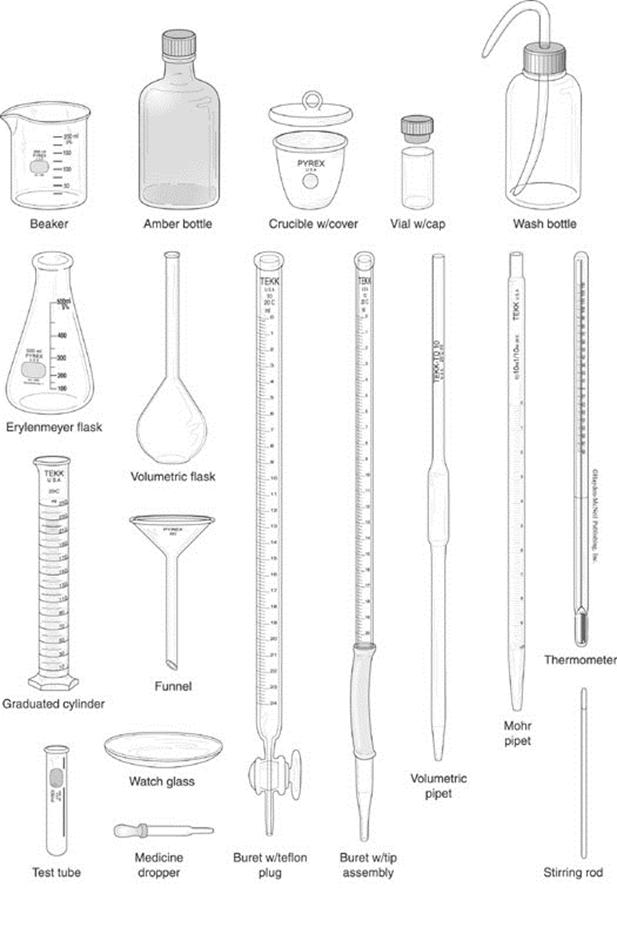
1. Volume measurement: Quantitative volume transfer using pipettors and volumetric pipets and familiarity with graduated cylinders, pump dispensers and Mohr pipets and calibration. Quantitative dilutions using volumetric flasks and precise volume transfer. Use of a buret in titrations and safe use of beakers, erlenmeyer flasks, and test tubes to conduct reactions. (Experiments 1, 2, 3, 4, 6)
2. Mass measurement: proper weighing technique including “weighing by difference” and use of the balance (Experiments 1, 2, 3, 4, 6).
3. Temperature measurement: use of thermometer (Experiments 1, 3, 4).
4. Time measurement: measuring the speed of a chemical reaction (Experiment 3).
5. Heating procedures: use of Bunsen burner & hot plate (Experiments 2, 3).
6. Qualitative analysis: using flame tests, observing and describing the formation and dissolving of precipitates and gases (Experiments 2, 3, 5).
7. Quantitative techniques: titration, pipetting, weighing (Experiments 1, 2, 3, 4, 6).
8. Proper cleaning of glassware, mixing of solutions, and use of reagents without causing cross-contamination (Experiments 1, 2, 5, 6).
9. Measuring emission spectra using spectrophotometer.
10. Laboratory safety: Conduct a risk assessment using hazard codes, labels, material data safety sheets, and other safety information to have awareness of lab hazards and respond with proper precautions. This involves the ability to use and disposal of chemical reagents and use lab equipment such as the fume hood safely and respond correctly in the event of an emergency. This also includes keeping work areas clean.
11. Collection of experimental data with correct significant figures and units.
B. Recognition of equipment found in your workstation and lab along with their use.
II. Calculations
A. The basic calculations used in this lab are important for your future work in chemistry and other sciences. Mastery of the following calculations and methods is expected:
1. Percent by mass (Experiments 2, 6).
2. Density (Experiments 1, 2).
3. Mass by difference (Experiments 1, 2, 3, 4, 6).
4. Using a chemical formula to calculate molar mass (Experiments 2, 6).
5. Conversion from grams to moles or moles to grams using the molar mass (Experiments 2, 6).
6. Use of concentration units such as molarity (Experiments 2, 3, 6).
7. Dilution calculations using M1V1=M2V2 (Experiments 3 and 6).
8. Use of chemical equations in calculations (Experiments 1, 3, 4, 6).
9. Calculation of the median and the average from a set of data taken in the lab (Experiments 1, 2, 4, 6).
10. Graphing data and interpreting graphical information (Experiments 1, 3, 4)
B. Data recording: proper format and rules.
C. Significant figures should be understood and the appropriate number of digits should be used for recording data, doing calculations, and predicting precision; in addition, mean or average, median, range, and error analysis will be used.
D. The use of unit cancellation or dimensional analysis, which has been introduced in the lecture course, will be used in all calculations to solve problems and check work in this lab course.
E. Graphing data and using linear regression and other functions to predict values.
III. Concepts
A. Mastery of the following concepts is expected:
1. Atomic emission and emission spectrum (Experiment 2, 4, 5).
2. Concentration (Experiments 2, 3, 5, 6).
3. Density (Experiments 1, 2).
4. Energy (Experiment 4).
5. Stoichiometry (Experiments 1, 3, 4, 6).
6. Qualitative analysis (Experiments 2, 3, 4, 5).
7. Acid-base reactions as used in titrimetry (Experiment 6).
8. Use of an acid/base indicator (Experiment 6).
9. Significant figures and unit cancellation (Experiments 1, 2, 3, 4, 6).
10. Treatment of Data – Graphing and Statistics (Experiments 1, 3, 4).
11. Using net ionic equations to express chemical reactions (Experiments 3, 5).
Safety in the Chemistry Laboratory
Laboratory safety involves the prevention of and response to laboratory emergencies. Good prevention is far better than someone getting hurt. This begins with always being aware of chemical and laboratory hazards. Hazard codes, chemical labels, and material safety data sheets are the first sources of information that help us prepare to work safely in a laboratory. This information can be used to do risk assessment on an experiment you are about to do. Certain rules need to be followed to keep you safe and you must know what to do in case of an emergency. Chemical waste management is another important aspect of a safe laboratory and a key regulatory compliance issue.
Chemical Labels, Hazard Codes, and Material Safety Data Sheets
The first source of information is the label on a chemical bottle. Read the label carefully before using a chemical. A commercial chemical bottle will have extensive information on the label such as the chemical name and formula, physical properties, purity, molar mass, hazards, safety precautions, suggested protective equipment, and other information. A hazard code may also be included on the label.
The chemistry department has adopted the “Baker” hazard code classification system to inform users of potentially hazardous chemicals. This system is designed to provide information to people who handle chemicals in laboratories. Hazards are classified according to four types: health (toxic), flammability (fire), reactivity (explosive or reactive), and contact (corrosive). The intensity of the hazard is indicated by using a number from "0" (no hazard) to "4" (extreme hazard). This information is conveyed using either a four-colored label found on "J.T.Baker" chemical products or as a series of four digits. The label on chemical bottles may look like this:
The four-digit hazard code used in the lab manual or on our reagent bottles may look like this:
1321
For example, the code listed above for acetone indicates a slight health hazard (1), a high flammability hazard (3), a moderate reactivity hazard (2), and a slight contact hazard (1). Hazard codes will be listed after the chemical inside parentheses: (1321)
The National Fire Protection Association (NFPA) uses a hazard code system that was adopted in 1975 to communicate hazards to emergency responders. This system uses a label that you may be familiar with since it appears on entrances to stores containing hazardous chemicals and on some chemical containers. The NFPA may differ from the “Baker” code since it provides information to firefighters while the “Baker” code provides hazard information in a laboratory situation. The codes are very similar except the white section in the NFPA code refers to special or specific hazards of importance to firefighters such as “ox” for oxidizing agent.
The Material Safety Data Sheet (MSDS) should be read to obtain additional safety information before the chemical is used. These sheets are available for all chemicals used in the chemistry department in room 212 of building 17 and in lab. They must not be removed from that room. The internet is a great resource for MSDS and general safety information.
Risk Assessment
A risk assessment determines what hazards will be encountered during an experiment or lab procedure, how to mitigate them (precautions such as goggles or gloves), and what should be done if something goes wrong. There may be physical or chemical hazards present that will be discussed in the experiment write up. Chemical hazards will be expressed using hazard codes and/or special warning stickers on bottle labels. If you observe a 3 or 4 in the hazard code you will want to obtain more information by referring to the material safety data sheet (MSDS) and note hazards and how to respond to them. For every experiment you must write a risk assessment and outline the experimental procedure before you start lab work.
How to Protect Yourself
1. Eye Protection MUST BE WORN IN THE LABORATORY AT ALL TIMES unless otherwise notified by the instructor or TA. Avoid rubbing your eyes in lab unless you wash your hands first. Use extra caution when using corrosive chemicals. Indirectly vented or nonvented goggles are the required eye protection for this lab course. Safety glasses or directly vented goggles are not acceptable. Do not modify or remove the vents on goggles. Write your name, course number, and section letter on your goggles.
2. Skin protection should be employed where appropriate; you may be required to wear long pants. Avoid wearing shorts. The use of a lab coat or plastic apron is recommended. Closed toed shoes must be worn at all times in the laboratory for protection against broken glass and spilled chemicals. Open-toed shoes or sandals are not appropriate footwear in lab areas. Disposable gloves are available for the handling of hazardous chemicals. Always remove them before exiting the lab. After completing lab work for the day, wipe down your entire work area (or any area used include balance, fume hoods, or reagent areas) with a clean damp sponge to clean up any spilled chemicals and other material. Rinse out the sponge several times and wring it out. Wash your hands as you exit the lab.
3. Protection from fumes or fine powders: Never allow hazardous chemical fumes or dust to escape into the open room; use fume hoods when necessary or specified. Be sure to use the fume hoods correctly, following the instructions provided by your TA or instructor. Avoid putting your head inside the fume hood and close the sash or fume hood window when it is not in use.
4. Protection from internal poisoning: Never "pipet by mouth", eat, drink, or smoke in the laboratory. These activities are prohibited. Wash your hands after you have completed lab work or leave the lab room.
5 Protection from hot surfaces: Use the appropriate types of tongs to handle hot objects. Test tube holders are too weak for carrying flasks.
6. Protection from fire and explosion: Never allow flammable vapors to escape into the open room (see No. 3). Ether is especially dangerous in this respect. Never use an open flame while flammable liquids are being used in the room. Hot plates should be used with care, as they are an ignition source. Flammable volatile liquids should be used in fume hoods and stored in solvent cabinets when possible. Long hair should be tied back to keep it away from open flames.
7. Protection from cuts: When manipulating glassware or ceramic ware, protect your hands with a cloth towel. Clean up broken glass immediately. Do not pick up broken glass with bare hands. Use a broom and dustpan to dispose of glass in the "Broken Glass Container". Do not clean up broken mercury thermometers without help from your TA since mercury requires special disposal procedures.
8. Protection from the unexpected: Always read all labels noting the chemical name, formula, concentration, and warnings (including hazard codes) carefully and double check to make sure you have the correct chemical and concentration. Follow directions in the experimental procedure exactly. Remove obstacles by keeping lockers closed, lab stools out of aisles, and backpacks and coats stored on coat rack. For unassigned lab work, you must have the approval of the instructor. Carefully follow hazardous waste disposal instructions given later.
9. Safety Violations: Any student who does not follow the above guidelines will be given one warning and will then be removed from the lab for the day for any subsequent violations. There may also be grade deductions or permanent removal from the lab for serious violations.
What to Do In Case Of Accident
1. During your first lab period, locate the position of the fire extinguishers, eyewashes, safety shower, first aid kit, phone, fire alarm pull stations, exits, hallway showers, material safety data sheets, and any other safety equipment.
2. In all cases of accident or injury, notify the TA and the instructor.
3. For any serious fire or injury: Call the POLICE DEPARTMENT (3-3000) from any campus phone or 523-3000 on a cell phone. Security is in the best position to summon fire or ambulance service. Call the Flagstaff Fire Department (8-774-1414) or dial 8-911 if Security cannot be reached. Use the FIRE ALARM PULL STAIONS (red box by every stairwell entrance) to clear the building of personnel. THE LOCAL FIRE ALARM IN THE LAB BUILDING WILL SUMMON HELP BUT STILL ALWAYS CONTACT CAMPUS SECURITY FROM A SAFE LOCATION. Students should stay with their lab TA as the building is evacuated if it is safe to do so.
4. In case of a small fire: Immediately get help from your TA or instructor. Fire extinguishers are rated for ABC type fires in chemistry where A is combustible (paper, etc.), B is flammable liquids, C is electrical, and D is combustible metals. Use dry sand for D type fires or a special extinguisher rated for these fires. To use an extinguisher remember “PASS”: Pull the pin, Aim the hose, Squeeze the handle, and Sweep the base of the flames. If a person's clothing is on fire, they should immediately stop-drop-roll, use the safety shower if it is close, or smother the fire with a lab coat or fire blanket. Cover beaker fires with a watch glass or larger beaker to remove oxygen and put out the fire. Cool minor burns in cold water immediately.
5. In case of chemical contact: If the area of contact is small, flush it well under the nearest water tap for 15 minutes. Eyes must be flushed immediately using the eyewash at one of the sinks or the eyewash by the safety shower keeping the contaminated eye(s) open. In case of large areas of contact, start rinsing the person using the safety shower and remove contaminated clothing. After decontamination, the person will be taken to a shower room by the prep stockroom where rinsing will continue for at least 15 minutes or until EMS arrives if called. Immediately inform the instructor or TA in any case.
6. In case of mercury spillage: To dispose of this hazardous material properly, notify your TA and he or she will collect the mercury using a special spill kit.
7. Chemical spill: If only a few drop of chemical are spilled, immediately clean up the material with a damp sponge and rinse out the sponge well at a sink and wipe down the area a second time with the rinsed out sponge. In case of a larger chemical spill immediately notify your TA and ask for help. Sodium bicarbonate (baking soda) can be used to neutralize acid spills. If the substance spilled is flammable, turn off all burners, hot plates, or electrical devices and get help from your TA. For large spills notify the instructor, the laboratory manager, or the stockroom manager. Clean-up materials are available in the lab or stockroom.
Hazardous Waste Disposal
The Resource Conservation and Recovery Act (RCRA) mandates the proper disposal of hazardous waste. Disposal of many waste chemicals by putting them down the sink is now illegal. Regardless of regulations, the proper management of hazardous waste is of particular importance to the people of Arizona where the contamination of groundwater by hazardous waste could have grave consequences. Please carefully follow the instructions below to protect our groundwater and keep your lab safe. Hazardous waste is determined by four properties:
TOXIC: A poisonous substance, potentially harmful to human health, can cause cancer or birth defects, or can contaminate, harm or kill wildlife.
FLAMMABLE: substances, which can explode, ignite, or emit toxic gases or fumes if exposed to a source of ignition.
REACTIVE: An unstable substance which can react spontaneously if exposed to heat, shock, air, or water. Reactions may include fires or explosions. The research director or instructor for the lab must neutralize any reactive substance before it can be accepted for disposal.
CORROSIVE: A substance that could corrode storage containers or damage human tissue upon contact. (For example, acids and bases, pH <4 or >10)
Chemical waste that does not fit into the above categories may be flushed down the drain with large amounts of water. The instructor or TA must be consulted if there is uncertainty with regard to the collection of a chemical waste.
All waste bottles are labeled and color-coded with tape. The label will include an experiment number and a hazardous waste description that will help you decide which bottles to put your waste into. Find the correct waste bottle for your experiment number and for the type of chemical waste you have; make sure the description of the composition fits the waste you are adding to the bottle. Using the wrong waste bottle could create a safety hazard and will be treated as a safety violation. The following table should help. Some nonhazardous chemical waste from experiments may be put down the drain. Avoid using cup sinks or water troughs to dispose of chemicals, instead use large sinks in the lab. Acidic or basic used chemicals (pH <4 or >10) will be disposed in the “Corrosive Liquids” bucket in a fume hood. Waste bottles are also color-coded using the following scheme:
Blue - health hazard (poisons, etc.)
Red - flammable hazard (organic solvents, etc.)
Yellow - reactivity hazard (strong oxidizers, etc.)
White - contact hazard (corrosives such as acids or bases, etc.)
Green - low hazard materials with hazard codes of 2 or less
|
Lab-Exp. |
Colors |
Description of Waste |
Comment |
|
5 |
Blue White |
Aqueous Cations & Anions: about 0.3% HCl, 0.2% Ag, 0.1% Ba, 0.2% Na, 0.5% NO3-, 0.2% Na2EDTA, 98% Water, and 0.5% total combination of trace Pb, Al, Co, Li, Fe, Ca, Zn, Fe, K, I, SO42-, NH4+, PO43-, HNO3 |
Keep in hood |
|
2,3,6 |
White |
Corrosive Liquids |
Keep in hood |
Handling Reagents and Standard Procedures
The liquids, solids, and solutions used in a laboratory are called reagents. You must become well acquainted with these reagents, their containers, and their proper use. The reagents are kept on a separate bench or hood away from your work area. Some reagents must be kept in the fume hood because they generate toxic fumes. The reagents are grouped according to experiment, starting with Experiment 1 and ending with Experiment 6. When you need a reagent please follow these rules:
1. Be sure to use the correct reagent, especially noting the concentration. Find the reagent, check the concentration, and then carefully read the label again to be sure you have the right one. Note the hazard code and take necessary precautions.
2. Obtain reagents from the reagent hood or bench. Do not take reagent containers to your work area.
3. Please conserve and take only what you need.
4. Do not contaminate the reagents. Always use a clean spatula for solids and clean glassware for liquids. Never put a pipet or pipettor into a liquid reagent, instead pour what is needed into a clean, dry container and take it to your work area.
5. NEVER return unused reagents, liquid or solid, to the reagent bottles. Discard or share any excess. Label any container you use to store a reagent with the chemical name and hazard or hazard code. The concentration and chemical formula and your name, section, and date would be good information to place on the label.
6. Put lids back on the reagent containers snugly and put back in correct locations.
7. Clean up any reagent you spill with a wet sponge, rinse out the sponge at the sink, and then wash your hands.
8. Use great care with corrosive chemicals (strongly acidic or basic solutions). Always wear safety goggles! Rinse your hands with tap water after using corrosive chemicals, especially if you feel a burning or slimy sensation on your skin. Wear the gloves provided in the laboratory if called for. Most strong acids and bases will be disposed of as a “Corrosive Liquids” in the hood as noted in experimental procedures unless the used chemical has other hazard properties.
9. Avoid using cup sinks to dispose of nonhazardous chemicals, instead use large sinks available in the lab. Be sure to follow the instructions in the experiments with regard to the disposal of chemicals.
10. Wash all glassware that you use. Often all that is needed is to rinse well with hot tap water 4 or 5 times. If the glassware is really dirty use detergent or simple green, then rinse hot tap water. Rinse all glassware with RO from a wash bottle. Test tubes, pipets, burets, and volumetric flasks should also be rinsed with a small amount of fresh RO water before storage. Fill your plastic wash bottle with RO water only for doing this. You do not need to dry the inside of glassware. Never store dirty glassware!
11. Hot objects can damage the lab bench surface. Never put hot objects on the bench top, instead place hot objects on the ring stand base or white hot pads provided. Hot crucible should not be placed on the pads.
12. At the end of every lab period you must clean your workstation bench space and any area you used by wiping it down with a clean, damp sponge. Rinse out and wring out the sponge when you are done. Your workstation drawer must be neat and complete with clean glassware and equipment for the next student. Do not store your googles, solutions, or unknowns in your workstation. Instead place them in the proper storage area in the drawers for your section.
Data Recording
Recording Experimental Measurements
Normally a laboratory notebook is used to collect data in a lab. It would serve several purposes; the most important of which is to be the permanent, understandable record of data collected and observations made during an experiment. In this course a report sheet is used instead of a laboratory notebook to provide more structure in data collection. The same rules used in a lab notebook will be used in this course. You should be able to look at your report sheet a year from now and be able repeat the experiment or calculations. Calculations should also be shown on the report sheet or an attached paper. Dimensional analysis or unit cancellation must be used to do all calculations in this course. If the same calculation is repeated several times, the calculation can be shown once. If a spreadsheet or graph is used to do the calculations, a copy of it must be stapled to the report sheet.
Before you start an experiment key aspects of the laboratory procedure should be outlined on the report sheet or an attached paper. Any procedures not in the lab manual including changes to procedures listed in the manual must be noted. Key data must also be recorded in the laboratory manual in case the report sheet is lost. Certain rules need to be followed when keeping a report sheet:
1. Record all data and observations directly on the report sheet in pen so that the data cannot be erased or changed. This is by far the most important rule in recording data. Do not transcribe data from other pieces of paper, i.e., DO NOT record data on scraps of paper and then recopy the data onto the report sheet. Write down exactly what you are doing and your observations as you are doing the experiment. Errors in your procedure can be caught this way. Points can be taken off for writing raw data in places other than the report sheet and not using a pen. If you run out of room on a report sheet you may staple a piece of paper to the report sheet to record more data.
2. Clearly identify all data, graphs, axes and use correct units. Use unit cancellation.
3. A ball point pen is normally used for all entries in a lab notebook but for this course you may use pencil to record calculated values if you wish on your report sheet but a pen must be used for all measured data (mainly mass and volume data) and observations. Do not white out, erase, or obliterate any entry; simply cross out mistakes with a single line (the mistake should still be readable) and give a short note to explain the nature of the mistake, e.g., "misread." Sometimes you will find later that the entry was not a mistake after all and will want to retrieve the data. So never obliterate or destroy data no matter how bad it looks!
4. Before an experiment is started, the entire experimental procedure must be read. As you read it, note the objectives and key points of the experimental procedure on your report sheet or a separate piece of paper. This will prepare you for the experiment before you come to lab.
5. Another important facet of scientific experiments involves the propagation of accuracy (or inaccuracy) of measurements through the calculations to the results. Use the correct number of significant figures, as outlined below, during the collection of data and calculations.
Recording Experimental Data Using Correct Significant Figures
It is important to take data and report answers such that both the one doing the experiment and the reader of the reported results know how precise the results are. The simplest, way of expressing this precision is by using the concept of significant figures where a significant figure is any digit that contributes to the accuracy of an experimentally measured number or to a number calculated from experimentally measured numbers. Please refer to the chemistry lecture textbook for a discussion of the use of significant figures.
In this laboratory course mass, volume, time, and temperature are experimentally measured and used to calculate density, concentration, percent by mass, and other values of interest. In CHM151L mass in grams (g) is always measured using a top loading electronic balance with a precision of ±0.001g. All mass measurement should be recorded to this precision even though the last digit may vary somewhat. For example if the mass of an object on a balance reads 25.001, 25.000, 24.999 and moves between these values, 25.000 should be recorded. Recording 25, 25.0, or 25.00 would be wrong since these would not communicate the true precision of the number. If values on the balance change randomly from 25.000, 25.001, to 25.002 then 25.001g should be recorded.
Time in seconds (s) is measured using a timer, stopwatch, or perhaps using a clock so the precision of the measurement might vary from ±1 to ±0.01 seconds. Always record the number to the maximum precision. Temperature will be measured using an alcohol thermometer that can be read to a precision of ±0.2°C so estimate to the tenth of a degree.
Measuring volume in mL is a tradeoff between speed and the precision of the measurement and requires skill in choosing the right glassware for the task. When an approximate volume is needed, a beaker, Erlenmeyer flask, or graduated cylinder can be used, but when an accurate volume is needed, a pipet, pipettor, buret, or volumetric flask will be specified for use. Recognizing when to make an accurate measurement and when to be satisfied with an approximate measurement can save much time. Frequently, the written directions will give clues to the needed precision by using the words "approximately" or "about" when the precision is not important and "exactly" or "precisely" when the precision is important. Another clue would be the number of significant figures used to write a number. For example, a volume of 5.00 mL would require the use of a 5 mL volumetric pipet or pipettor to measure the desired volume. On the other hand, a volume expressed as “about 5 mL” would require only a small beaker or graduated cylinder to measure the volume. It is also important to note that glassware used for accurate measurements is calibrated at a specific temperature, which is noted on the glassware. The precision of various types of glassware is shown in the following table.
Precision of Glassware for Volume Measurement
|
Equipment |
Precision |
Purpose of Glassware/Equipment |
|
250 mL Beaker |
±10 mL |
Solution preparation, storage, reactions |
|
125 mL Erlenmeyer flask |
±6 mL |
Solution preparation, storage, reactions |
|
250 mL graduated cylinder |
±1 mL |
Volume transfer – moderate precision |
|
25 mL graduated cylinder |
±0.2 mL |
Volume transfer – moderate precision |
|
5 mL bottle top dispenser |
±0.1 mL |
Volume transfer – moderate precision |
|
100 mL volumetric flask (class A) |
±0.08 mL |
Precise final volume for dilutions |
|
10 mL measuring pipet (Mohr) |
±0.05 mL |
Volume transfer – good precision |
|
5 mL pipettor |
±0.025 mL |
Volume transfer – very precise |
|
25 mL buret |
±0.02 mL |
Precise volume delivery for titration |
|
5 mL, 10 mL volumetric pipet |
±0.01 mL |
Volume transfer – very precise |
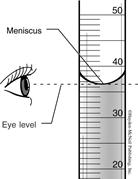
When a measurement is made, the question arises: "How many digits or figures should be recorded?" The answer is straightforward: For a measured number record all digits, which are known with certainty, and the last digit, which is estimated. Many of the measurements in this course involve the estimation to the nearest one-fifth or one-tenth of a scale marking. For example, in Experiment 1 a 25mL graduated cylinder, which has scale markings every 0.5 mL, should be read to the nearest 0.1 mL, estimation to the nearest one-fifth of a division. The graduated cylinder does not need to be used to this accuracy at all times; for example, if the instruction say “add about 25mL of water” being within 1-2 mL of 25 would be ok.
NOTE: Whenever estimation between markings is being done and the reading is "on the mark," the last digit should be included to convey the idea of accuracy to the reader. For example, with a buret, which has markings every 0.1 mL, a reading on the mark of 11.3 mL would be recorded as 11.30 mL; otherwise, the reader will not know that the buret was really read to the nearest 0.01 mL.
Another factor to take into account when measuring volume is the level of hazard for the chemical being measured. Bottle top dispensers will often be used to dispense more hazardous liquids. Pump dispensers reduce the amount of transfers from one container to another and can be used with good precision. Be sure to familiarize yourself with the use of each type of pump dispenser. Slow deliberate use of the dispenser will help insure that the right volume is delivered.
Sometimes approximate small amounts of liquid are needed. In this case instructions may indicate measure out drops from a dropper bottle or eye dropper. One drop of water or a dilute solution on average is about 0.05 mL. This can also be a safer method because it does not involve pouring the liquid from one container to another.
Generally speaking all the glassware in the table above is for transferring known volumes of liquid from on container to another except for the beaker and flasks. Beakers along with erlenmeyer flasks are generally used for conducting chemical reactions or other lab manipulations. The volumetric flask is used for preparing precise solutions or dilutions.
Calculated Values and Tracking Uncertainty Using Significant Figures
Recorded data is then used to calculate some value of interest in one or more steps. You will need to know how precise or how many significant figures an answer should have depending on the precision of the data or calculated values used in the calculation and the type of math operation done. If you are unsure how many significant figures to use for calculated values it is better to use too many than too few. Using too few significant figures will introduce rounding errors into final answers!
Reporting Answers in Addition and Subtraction
When experimental data has been recorded correctly, the uncertain or estimated digit is the last digit. The calculated sum or difference of experimental measurements must be carried out only to the place where the first digit of uncertainty enters the calculation. Example: Add 14.75, 1.475, and .001475 (all of which are experimental numbers). The digits of uncertainty are underlined.
14.75
1.475
0.001475
--------------
16.226475
Since the answer may include only the first digit of uncertainty, it should be rounded off to that digit and reported as 16.23. It helps to line the numbers up by the decimal point.
Reporting Answers in Multiplication and/or Division
1. All measurements should be recorded to the appropriate number of digits as discussed in the section on recording experimental data.
2. The position of the decimal point is ignored in counting the number of significant figures.
3. All digits except zero are always significant.
4. Zeros may or may not be significant. Any zero to the left of the first non-zero digit is never significant (0.02562 has 4 significant figures because neither zero is significant). Using exponential form, 2.562 x 10⁻², clarifies this issue.
a. Any zero to the right of the first non-zero digit is always significant if there is a decimal point (2.5070 has 5 significant figures since both zeros are significant).
b. If there is no decimal point, zeros to the right of non-zero digits are ambiguous. For example, if all the zeros are significant in 25000 (five significant figures) it would be much better to write the number in exponential form as 2.5000 x 10⁴ to convey the precision. If the number is known to less precision, say three significant figures, it should be written as 2.50 x 10⁴ to remove any question about the precision.
4. In multiplication and/or division, the answer should be reported to the same number of significant figures as the value in the computation with the least number of significant figures
Example: Find the answer to the following multiplication/division problem to the correct number of significant figures.
0.085 has 2 significant figures; 0.08206 has 4; 366 has 3; 0.782 has 3; and 0.14200 has 5. A calculator shows the answer to be 22.989865, so the answer should be reported as 23 since the number with the fewest number of significant figures, 0.085, has 2 and dictates the precision of the result.
Interpretation of Data
Significant figures are excellent to express the precision of raw data but not always so good to express the precision of calculated values. As a general rule in this laboratory course you should always use at least four significant figures for calculated values to avoid rounding errors. Once the final answer is calculated, it can be expressed using correct significant figures. In order to interpret how good your results are, certain terms need to be understood. You will need to understand the following definitions.
1. Accuracy: The term "accuracy" describes the nearness of a measurement to its accepted or true value. In CHM 151L, the accuracy of your work becomes known when your unknown is graded. A PASS grade indicates good accuracy, a PARTIAL CREDIT grade indicates marginal accuracy, and a REPEAT grade indicates that your results had poor accuracy.
2. Precision: The term "precision" describes the "reproducibility" of results. It can be defined as the agreement between the numerical values of two or more measurements that have been made in an identical fashion. Good precision does not necessarily mean that a result is accurate.
3. Range: The "range" is one of several ways of describing the precision of a series of measurements. The range is simply the difference between the lowest (or lower) and the highest (or higher) of the values reported. As the range becomes smaller, the precision becomes better.
Example: Find the range of 10.06, 10.38, 10.08, and 10.12.
Range = 10.38 – 10.06 = 0.32
4. Mean: The "mean" or "average" is the numerical value obtained by dividing the sum of a set of repeated measurements by the # of individual results in the set.
Example: Find the mean of 10.06, 10.38, 10.08, 10.12
(Note that the value 10.38, which is far greater than the other values, has a large influence on the mean, which is larger than three out of the 4 individual values.)
5. Median: The "median" of a set is that value about which all others are equally distributed, half being numerically greater and half being numerically smaller. If the set has an odd number of measurements, selection of the median may be made directly. (Example: the median of 7.9, 8.6, 7.7, 8.0 and 7.8 is 7.9, the "middle" of the five). For an even number, the average of the central pair is taken as the median (Example: the median of 10.06, 10.38, 10.08, and 10.12 is 10.10--the average of the middle pair of 10.08 and 10.12). Notice in the example that the median is not influenced much by the value 10.38, which differs greatly from the other three values. For this reason, the median is usually better to use in reporting results than the mean for small data sets.
6. Error: The absolute error of an experimental value is the difference between it and the true value. For example if the experimental value is 30.9 and the true value is 26.5, the error would be 30.9–26.5 or 4.4.
7. Relative percent error would be the error divided by the true value times 100: (4.4/26.5)x100%=16.6% or 17%.
You will also be graphing data using a program called Graphical Analysis and doing a linear fit or regression to examine the linearity of data sets. The correlation coefficient from doing the linear regression indicates how linear the data is where 1.0000 would indicate perfectly linear data and smaller numbers such as 0.6000 a much poorer fit. You will also be using various mathematical algorithms to fit data in experiment 3. Instructions for using this graphical analysis are provided at the end of experiment 1. In some cases you may use excel or other software to graph data.

Experiment One: Measurement of Mass,
Volume, Density, and Fermentation
Purpose: In this experiment, you will learn fundamental techniques for measuring mass and volume and apply these techniques to the study of density and fermentation using related concepts and calculations. Evaluating technique mastery by checking calibration using the average, median, range, and error and expressing data to correct significant figures using unit cancellation (dimensional analysis) for all calculations is fundamental. By the end of this experiment you should be able to choose glassware and equipment based on the precision and speed required for a measurement. Using these skills to scientifically and critically think about an experiment and the results will be used throughout this and future lab courses.
Required Techniques and Concepts: Mass measurement, quantitative volume transfer by pipettor, volumetric and mohr pipet, and graduated cylinder, checking calibration using the mass and density of water at a measured temperature, density, precision by significant figures and range, average, unit cancellation (dimensional analysis), graphing and linear regression.
Background: Density is a characteristic physical property of matter that can be used to help identify a substance. The density of any given substance or object refers to its mass per unit volume. It is mathematically expressed as
![]()
and commonly has units of grams per cubic centimeter (g/cm3) or its equivalent, grams per milliliter (g/mL). For example, aluminum has a density of 2.70 g/cm3 and nickel has a density of 8.90 g/cm3, so measuring the density of a piece of metal would be one way to tell which metal it could be. Other properties, such as appearance, melting point, and chemical reactivity, could then be used to confirm the identification.
Fermentation is the reaction (oxidation) of certain types of carbohydrate, sugar in this case, to ethanol and carbon dioxide with yeast catalyzing the reaction as noted below.
C6H12O6
(aq) ![]() 2 CH3CH2OH
(aq) + 2 CO2 (g)
2 CH3CH2OH
(aq) + 2 CO2 (g)
Sugar Ethanol Carbon Dioxide
Yeast acts on the sugar using enzymes to catalyze several chemical reactions to produce ethanol. This reaction is of special interest beyond the production of beer, wine, and other alcoholic beverages in view of the limited nature of oil resources and the effects of global warming. Ethanol produced from fermentation can used in place of gasoline refined from oil yet has been reported to have a smaller carbon footprint. There is currently much research aimed at creating microbes that can breakdown unused plant matter such as corn stalks (cellulose) to ethanol. The complete burning or oxidation of organic materials such as oil and coal to carbon dioxide producing huge amounts of energy has fueled the industrial revolution and our modern society.
C6H12O6 (aq) + 6 O2 (g) → 6 H2O (l) + 6 CO2 (g) + energy
The oxidation of a specific group of organic chemicals called carbohydrates, to carbon dioxide via metabolism supplies the energy for oxygen consuming life on earth. Understanding reactions such as these is central to our understanding of life as we know it. We will look at the fermentation reaction in this experiment and the relationship of yeast and carbohydrate (sugar) to the amount and rate of ethanol production.
Fermentation has been utilized for many years in the preparation of beverages. Materials from Egyptian tombs demonstrate the procedures used in making beer and leavened bread. The history of fermentation, whereby sugar is converted to ethanol by the action of yeast, is also a history of chemistry. Van Helmont coined the word “gas” in 1610 to describe the bubbles produced in fermentation. Leeuwenhoek observed and described the cells of yeast with his newly invented microscope in 1680. Joseph Black discovered carbon dioxide and showed it to be a product of fermentation in 1754. Lavoisier in 1789 showed that fermenting sugar produces ethanol and carbon dioxide, and he made quantitative measurements of the amounts consumed and produced [1].
In 1815, after the mole concept was established, Gay-Lussac showed that one mole of glucose produces exactly two moles of ethanol and two moles of carbon dioxide. But the process of fermentation puzzled some great chemists. Kutzing wrote in 1837, “It is obvious that chemists must now strike yeast off the role of chemical compounds, since it is not a compound but an organized body, an organism.” And then there were chemists such as Berzelius, who believed that yeast had a catalytic action [1].
It remained for Pasteur to show that fermentation was a physiologic action associated with the life processes of yeast. In his classic paper of 1857, he described fermentation as the action of a living organism. However, other chemists disputed his findings because the conversion of glucose to ethanol and carbon dioxide is a balanced equation. So a search was begun to find the substance in yeast that might cause the reaction. It took 40 years before a clever experiment by Eduard Buchner ended the search. He made a cell-free extract of yeast that still caused the conversion of sugar to alcohol. This cell-free extract contained the catalysts, which we now call enzymes that are necessary for fermentation. This discovery earned Buchner the 1907 Noble Prize. In 1905 Harden discovered that inorganic phosphate, added to the enzymes, increased the rate of fermentation and was also consumed itself. This result led to the isolation of many other types of sugars. Clearly, the history of biochemistry is closely associated with the study of alcoholic fermentation [1].
Ancient peoples discovered many of the essential reactions of alcoholic fermentation completely by accident. How did they discover that the starch of wheat or barley could be converted to sugar by the enzymes in malt? When grain germinates, enzymes are produced that turn the starch into sugar. The process of malting involves letting the grain start to germinate and then heating and drying the sprouts to stop the process before the enzymes are used up. The color of the malt depends on the temperature of the drying. The darkest is used for stout and porter, the lighter, for brown, amber, and pale ale. At some point hops were added to beer when it was discovered that the resulting beverage did not spoil so rapidly [1].
In this experiment alcoholic fermentation will be explored through a reaction similar to the traditional production of cider. This fairly simple method calls for picking apples, aging them for a week and then crushing them using a cider press to collect the juice. The freshly pressed juice is then fermented by immediately storing the juice in a wooden barrel and allowing wild yeast to ferment the juice. The fermentation starts in 1-2 days and continues for several weeks, during which time the barrel is topped off with more juice. Once fermentation is over, the barrel is sealed and matured for 5-6 months [2]. The cider made in this experiment will be prepared using apple juice and bread yeast or, if available, a dry wine yeast.
This part of the experiment involves the fermentation of apple juice to cider. The study of chemical reactions and the chemical equations that help describe them is central to the study of chemistry. We will test the hypothesis that the amount of product produced by a chemical reaction can be predicted using the chemical equation for the reaction knowing the amount of starting material. We will also look at how experimental parameters and limitations in measurements affect results. This part of the experiment will begin in the first week of the experiment and be completed the second week.
The Experiment
Since the primary purpose of the experiment is to master key techniques and calculations use throughout this lab course you must do the experimental work by yourself not in a group. To learn technique you must do it yourself! The only part of the experiment this does not apply to is collecting the fermentation data which is done in groups of 2-4 students. There are also videos available on using the balance, volumetric and mohr pipets, and pipettors you should view before starting this experiment that can be found on the instructional labs homepage.
Risk Assessment – low hazard: no hazardous chemicals in use.
Equipment and Supplies Needed – electronic balance, calibration weights, Cu and Al metal pieces, unknown metal bars for unknown (checkout at stockroom), graduated cylinders (10, 25, 50, 100, 250, and 500 mL), 125 mL erlenmeyer flask (on reagent bench), yeast, apple juice, balloon, twist ties and/or rubber bands, volumetric pipet (5 and 10 mL), 10mL mohr pipet, 50 and 100 mL beakers, two vials with lids, 5mL pipettor and tip, two pump dispensers, thermometer.
Measurement of Mass
There are many different types of balances or scales available to measure the mass of an object. The selection of the balance depends on the mass of the object or sample and the precision needed for the measurement. In this course the measurement of mass will be done using top loading electronic balances. Our balances accurately measure mass to ±0.001 g or ±1 mg, so always record masses determined on these balances to this precision (three digits to the right of the decimal place in grams) even if the last digit is zero. All mass measurements will be done in grams so make sure any balance you use is reading in grams (g). If not see the TA immediately to get the mode changed back to “g”. Please note that balances will change in the last digit ±0.002 g; this is to be expected.
There are many different types of electronic top balances but they all use the same two simple procedures. To simply weigh an object tare the balance to zero and then place the object on the balance to measure its mass. Weighing-by-difference is used to measure the mass of a sample being transferred from one container to another and will be used in experiment 6. A few rules need to be followed when using a balance.
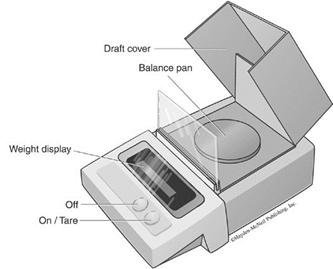
Figure 1. Top loading electronic balance
Balance Rules and Instructions
Figure 1 illustrates one type of top loading electronic balance, which is one type of balance used in CHM 151L. Refer to this figure when following the steps and precautions for using the balance listed below:
1. Never pour or transfer chemicals over the balance. Spilled chemicals can damage the balances, which are very expensive to repair or replace. Never weigh warm or hot objects; if you can feel any heat, the weighing will not be accurate. Always use a container such as a vial, beaker, flask, or watch glass to weigh a solid or liquid chemical on the balance to protect the balance pan.
2. Make sure your hands are clean and dry before you handle containers or objects that are to be weighed. The outside of these containers or objects must also be clean and dry. Clean up any spills on the balance pan or lab bench around the balance immediately with a clean, damp sponge.
3. First open or remove the draft lid or cover (if there is one) and check to make sure that the balance pan is clean. If the pan is dirty, have your TA show you how to clean it and gently place it back on the balance.
4. Close or put the cover back on the balance and zero the balance by pressing the "T" or "on/tare" button. Wait 5-10 seconds for the weight display to stabilize. (If the object to be weighed is so large that the draft lid can't be used, do this step without the draft lid in place.)
5. Open or remove the draft lid and place the object to be weighed on the balance pan. Then close or place the draft lid back on the balance. (As long as it does not touch the object to be weighed, leave the lid off if it does touch the object.) After 5-10 seconds the weight display will stabilize and then record mass to ±0.001 g.
6. Never unplug the balance but be sure to turn it off at the end of the day.
Weighing Solids and Liquids
Since using the top loading electronic balance is so much easier than using the old triple beam balances or 1 mg mechanical analytical balances, very few errors are made measuring the mass of an object. Most errors are made when trying to measure the mass of solid or liquid transferred from one container to another (weighing by difference). The following are some helpful hints to keep in mind when weighing by difference.
1. Be very careful to avoid spilling material outside the target container.
2. If you are weighing the container that the material is being transferred from, do not use a spatula to transfer the material, but gently tap the container to slowly transfer the material into a new container.
3. Make sure the outside of the container is clean and dry before you weigh it for the first time and then touch it as little as possible until after the final weighing.
4. Set containers to be weighed on clean surfaces only.
5. Always cool containers or samples to room temperature before you weigh them.
6. It is sometimes helpful to preweigh the sample before it is transferred.
Some of these hints will be more important in future experiments (especially Experiment 6)
Part A - Balance Calibration Check
All of the balances are regularly checked for correct calibration by the stockroom. To insure that you are using the balance correctly and that it is properly calibrated, the mass of a calibration weight will be measured. Calibration weights are provided in small wooden boxes. Make sure your hands are clean and dry before you touch the weights. (Normally calibration weights are not touched with your hands.)
Select a calibration weight and record the "Known Mass" for the weight (stamped on the weight) on the report sheet found at the end of this experiment. Measure the mass on a balance and record it on the report sheet. If the measured and known mass differ by more than 0.01 g reread the instructions for using the balance and measure the mass of the calibration weight again. If you get the same results again, see your instructor or TA.
Part B - The Density of a Metal Samples and Fermentation
Obtain an Aluminum (Al) metal sample from the reagent bench. You must return this metal sample to the box on the reagent bench as soon as you are done using it or before the end of the current lab period at the latest.
Make sure the metal sample is clean and dry. Weigh the metal sample on the balance and record the mass.
Note: Water is purified using various techniques to varying levels of purity measured by electrical conductivity. For this lab course we will use tap water for general washing and do a final rinse with water purified by reverse osmosis (RO), carbon filtration, and deionization. The water is also treated with UV (to kill bacteria and other microbial impurities. There are RO water carboys by each sink in each lab. Fill the plastic wash bottle with RO water for use with your experiments. Never put anything but RO water in these wash bottles. There may also be a rinse tub of RO water to give cleaned glassware a final rinse. Water may also be purified by distillation and other steps to even higher levels of purity. Pure water in this course will be referred to as RO but often it is referred to as distilled or deionized water depending on the purifications process used. So use RO water in your experiments when pure water is called for.
Fill a 25 mL graduated cylinder approximately halfway with RO water. Read the volume of water accurately by estimating to the nearest 0.1 mL. Record the result on the report sheet.
Figure 2. Always read the bottom of the
Densities of Metals meniscus. This reading is 36.5 mL.
|
Symbol |
Metal |
Density(g/mL) |
|
Al |
Aluminum |
2.7 |
|
Cr |
Chromium |
7.2 |
|
Fe |
Iron |
7.9 |
|
Cu |
Copper |
8.9 |
|
Ni |
Nickel |
8.9 |
|
Ag |
Silver |
10.5 |
|
Pb |
Lead |
11.3 |
|
Hg |
Mercury |
13.9 |
|
Au |
Gold |
19.3 |
Then carefully lower the aluminum metal sample into the graduated cylinder without losing any water. Be sure that the water completely covers the sample and that the meniscus is still within the volume scale of the graduated cylinder. If not, start the procedure over using more or less water. Read the total volume of the contents in the cylinder and record it on the report sheet. Repeat this procedure with one piece of the copper sample. Record the data for each trial directly on your report sheet. Immediately return the metal samples to the reagent bench (do not store them in your workstation drawer).
Calculate the volume of each metal sample. Finally, calculate the density in g/mL of each sample. Compare the densities you measured with those listed on the previous page. The density for Al should be very close to the listed value (if not see your TA), but the density for Cu may differ from the listed value by a large margin. Explain why the value for Cu is poorer than that for Al. What measurement limits the precision or accuracy? Now modify the procedure for measuring the density of Cu so that the density can be measured more accurately. Write your procedure on your report sheet and use the procedure to measure the density of your copper sample again. A very common source of error in the experiment is from inaccurate reading of the graduated cylinder.
Fermentation of Apple Juice to Cider – First Week (Group Work - data collection only)
We will look at fermentation by measuring the amount of carbon dioxide produced by measuring the mass change using varying amounts of apple juice and yeast. What do you think will happen during fermentation to the mass of the system (mass flask+yeast+apple juice) based on the chemical reaction for fermentation? What effect would changing the mass of apple juice or mass of yeast used have on the final mass of carbon dioxide produced? Keep these question in mind as you analyze the final fermentation data.
Your TA will assign you to one of six lab groups of 2-4 students based on the side of a bench you’re on. Every student will record data for the fermentation on their report sheet. Each group should take a dry 200 or 250 mL Erlenmeyer flask out of the box on the reagent bench and label it with the section letter and group number. Weigh the flask. Preweigh the mass of yeast for your group to be within the range as noted in the table below into a clean, dry vial (tare the vial mass to zero to help in weighing out the yeast). Add the yeast in the vial to the empty flask and reweigh the flask. Now add the volume of apple juice indicated for your group in the table below to the flask using a 25 or 10 mL graduated cylinder. Make sure the outside of the flask is clean and dry and obtain the mass of the flask containing the juice and yeast.
|
Group Number |
1 |
2 |
3 |
4 |
5 |
6 |
Control |
|
Grams of Yeast |
0.008-0.010 |
0.008-0.010 |
0.008-0.010 |
0.008-0.010 |
0.004-0.006 |
0.002-0.003 |
0.008-0.010 |
|
Volume of Apple Juice (mL) |
20 |
15 |
10 |
5 |
5 |
5 |
5 mL of RO water |
Once this is done, place a balloon over the top of the flask, making sure the balloon stretches approximately 1 inch down the neck of the flask. Now place a twist tie or rubber band tightly around the neck of the flask to help seal the balloon on the flask. The setup will be kept in your lab’s storeroom in the cabinet for your section. An assigned group or student will also setup a control with the same conditions as group 4 but using RO water instead of apple juice (why might the mass of the control change?). Calculate the mass of yeast and apple juice then density of the apple juice using its mass and volume.
Look at the label of the apple juice bottle to determine the mass of carbohydrate per serving volume. If we assume that nearly all of the carbohydrate is present as sugar we can predict for every mole of sugar two moles ethanol and two moles of carbon dioxide will be produced. For example, if the label says that there is 28g of carbohydrate per 240 mL (standard serving size) that means 13.7 g carbon dioxide and 14.3 g of ethanol will be made if the reaction converts carbohydrate in 240 mL to products. Using the chemical equation for fermentation, molar masses of sugar and carbon dioxide, the mass of carbohydrate (MS) per serving (8 fl. oz. or 240 mL, off label), and the volume of apple juice used by your group (VAJ), the predicted mass of carbon dioxide made can be calculated using the following formula:
![]()
So the Predicted Mass CO2 Made = 0.002036 (MS) (VAJ)
As you progress in your lecture course this semester the setup of this calculation using dimensional analysis will become much easier. Also investigate the percent alcohol values for beer, wine, whiskey or other alcoholic beverages and record on the report sheet by next week.
The Density of an Unknown Metal Bar
Now go to the chemistry stockroom and check out a metal bar with an unknown density. Record the bar number on your report sheet. Follow the procedure used for Al to determine the density of the unknown and do two trials. Immediately return this bar to the stockroom when you are done. Do not put it in your workstation drawer. Be sure to use the calculation check to make sure your density calculations are correct and print a copy of it to attach to the report sheet. In addition to recording the final results for the unknown on the report sheet also record them in the space provided at the end of the experiment in case the report sheet is lost.
Part C - Volume Measurement and Calibration:
You are now familiar with the graduated cylinder. In this part of the experiment the use of the volumetric pipet, the Mohr pipet, bottle top dispenser, and pipettor will be mastered. Use the report sheet at the end of this experiment to record your results. Before you begin, view the videos on using this equipment if you yet to do so.
Figure 3. Using a Volumetric Pipet.
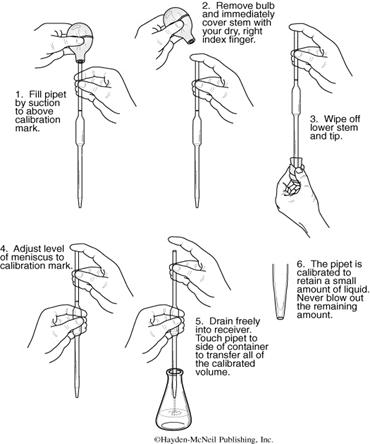
Blowup of steps 2, 4 and 6.
(1) The rubber bulb in your locker should have a pipet adapter or a disposable plastic pipet tip attached (if not, see your TA). The pipet is filled by placing a depressed rubber bulb assembly in the top and slowly releasing the bulb, thereby drawing liquid up into the pipet above the graduation line. Be careful not to draw the liquid into the bulb, as the bulb will contaminate the liquid.
(2) Remove the rubber bulb and immediately place your index finger on the top of the pipet.
(3) Wipe the outside of the pipet with a paper towel.
(4) While resting the tip of the pipet on the top inside portion of the container holding the solution, carefully raise your finger to release enough liquid so that the bottom of the meniscus is on the graduation mark.
(5) You are now ready to dispense a specific quantity of liquid; touch the inside upper wall of the target container with the tip of the pipet as you drain it. Hold the tip to the wall 5-10 sec. after the liquid has drained out. Note: If any droplets are found to be adhering to the inner walls of the pipet, it is dirty and should be cleaned. Try cleaning the pipet using hot soapy water. Draw the soapy water up into your pipet several times using your rubber pipet bulb. Then rinse the pipet several times with tap water and finally once with RO water. If the pipet is still dirty take it to the chemistry stockroom where it can be exchanged for a clean one. Be sure to view the video on the pipet.
CAUTION: Do not use your mouth to draw liquid into the pipet. Use the pipet bulb and tip provided.
Calibration of Volumetric Pipets
You will begin by calibrating your volumetric pipets with RO water. First, be sure your pipets are clean (review figure 3 before using your pipets). The pipet bulb should have a plastic pipettor tip or adaptor that makes the bulb easier to use. If the bulb draws the liquid up slowly make sure the plastic tip or adaptor and bulb make a good seal. Take some time now to practice using your pipets and make sure they are clean. Start by using pure water practice making 2 or 3 transfers with the 10 mL pipet. Measure the temperature of the pure water and record it on the report sheet. Using the correct size pipet, transfer the volume called for into an empty dry vial with cap that has been weighed to the nearest milligram. Cap the vial to prevent evaporation and weigh the capped vial with the water. Subtract the two masses to get the mass of water transferred. The volume of water delivered is then calculated by dividing the mass of the pure water by the density.
![]()
![]()
The density of water can be obtained from the table below using the temperature of the water. Use the density for the temperature closest to the temperature you measured and record it on your report sheet. Calculate the error by subtracting the volume actually delivered (calculated above using the mass and density) from the volume you tried to deliver (size of volumetric pipet used).
The volume for each pipet should agree with the pipet size within ±0.05 mL. If the error in volume is greater than ± 0.05 mL, you have either made a pipetting error, your pipet is dirty or damaged, or possibly the calibration of your pipet is off. In any case repeat the calibration and get some help from your TA if you get the same result a second and third time.
Density of Water
|
|
Temperature |
Density |
Temperature |
Density |
|
|
(Degrees Celsius) |
(g/mL) |
(Degrees Celsius) |
(g/mL) |
|
|
14 |
0.9993 |
25 |
0.9971 |
|
|
15 |
0.9991 |
26 |
0.9968 |
|
|
16 |
0.9990 |
27 |
0.9965 |
|
|
17 |
0.9988 |
28 |
0.9963 |
|
|
18 |
0.9986 |
29 |
0.9960 |
|
|
19 |
0.9984 |
30 |
0.9957 |
|
|
20 |
0.9982 |
31 |
0.9954 |
|
|
21 |
0.9980 |
32 |
0.9950 |
|
|
22 |
0.9978 |
33 |
0.9947 |
|
|
23 |
0.9976 |
34 |
0.9944 |
|
|
24 |
0.9973 |
35 |
0.9941 |
Calibration of the Mohr Pipet
The Mohr pipet and the buret (the buret will be used in experiment 6) are graduated or read from the top down instead of from the bottom up like the graduated cylinder. This often creates confusion when reading the Mohr pipet or buret but this makes them valuable for transferring variable amounts of liquid with precision. Become familiar with the use and the
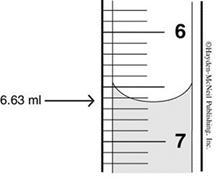 Figure 4; illustrates a portion of the scale of a Mohr pipet or a
buret. Reading the scale from the top down, the bottom edge of the meniscus
is resting on 6.63 mL and not 7.37 mL. To deliver a specific volume,
fill the Mohr pipet to above the zero mark and drain such that the bottom of
the liquid (meniscus) is on zero or below and note the volume. Then, deliver
the required amount of solution and note the new volume on the scale. The
volume delivered is the difference between the first and second readings.
Practice using the Mohr pipet and make sure it is clean.
Figure 4; illustrates a portion of the scale of a Mohr pipet or a
buret. Reading the scale from the top down, the bottom edge of the meniscus
is resting on 6.63 mL and not 7.37 mL. To deliver a specific volume,
fill the Mohr pipet to above the zero mark and drain such that the bottom of
the liquid (meniscus) is on zero or below and note the volume. Then, deliver
the required amount of solution and note the new volume on the scale. The
volume delivered is the difference between the first and second readings.
Practice using the Mohr pipet and make sure it is clean.
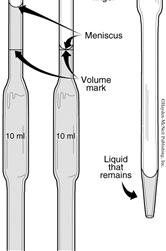
calibration of the Mohr pipet. Because of the design of most of our Mohr pipets, you don’t completely drain them to transfer 10 mL. Instead, if you start at 0, the pipet is drained from the 0 to the 10 mL calibration marks on the graduated scale. Some Mohr pipets are calibrated all the way to the tip of the pipet. In this case the graduations indicate that the pipet should be completely drained to deliver 10.00 mL. Both this type of mohr pipet and our volumetric pipets are “To Deliver” or “TD” type pipet. This means that the tiny amount of solution left in the tip after a transfer is not blown out!
As was done for the volumetric pipet, transfer 10.00 mL of RO water using a 10 mL mohr pipet to a preweighed vial and reweigh the vial with the water to complete the calibration. Calculate the mass of water transferred and then use the density to calculate the volume transferred. Subtract this volume from 10.00 to obtain the error.
Graduated Cylinder and Beaker
Repeat the same calibration procedure used for the pipets above. Measure out 10 mL of RO water with your 25 mL graduated cylinder. Weigh the water transferred to the vial and calculate the volume transferred or "calculated volume" using the density of water as was done for your pipets. Calculate the error in volume by subtracting the volume calculated from 10.00mL. Record your results on the report sheet for experiment one. Repeat this procedure transferring 10 mL of RO water using a 50 mL beaker.
Comparison of Glassware Accuracy
The terms "accuracy", "precision" and "range" are defined in the Introduction. The choice of glassware to measure volume is dependent on the goal of the experimental procedure, the volume size, the precision required for the final answer, and the time it takes to perform the manipulation. The measurement of volume is a tradeoff between speed and precision. More precise measurements are generally more time consuming. If a procedure called for 10.00 mL for one part of the experiment and about 10 mL for another part, different types of glassware would be used to measure the volumes. Let's look at the accuracy to which differing glassware can measure volume.
For each type of glassware you should have now calculated the volume delivered using the density of water and determined the error in volume delivered (volume to transfer minus calculated volume delivered). The error in these measurements will give an indication as to just how accurate each type of glassware is (a smaller error indicates higher accuracy). Answer the questions on the report sheet regarding glassware design (diameter at calibration markings) and volume errors.
Compare these errors to the precision listed for similar glassware in the table on page 11 in the significant figures section of the Introduction. Complete and print the calculation check for this part of the experiment.
Bottle Top Dispensers
Bottle top dispensers are used to quickly and safely dispense liquids with some, but not exceptional precision. There are two general types of pump dispensers that you will be using, with and without spring loading refilling. In this lab we will use these to provide approximate amounts of liquids. You will practice with each and then check the calibration on both types. The following steps should be followed when using a bottle top dispenser without spring loaded refilling:
1. Make sure the dispenser is set for the right volume. See your TA if it is not. DO NOT CHANGE SETTINGS ON THE PUMP DISPENSOR! LEAVE ALL ADJUSTMENT SCREWS UNCHANGED!
2. Make sure the dispenser has been primed and checked. See your TA if you are unsure about this.
3. Bring the container you want to transfer the sample into and hold it under the tip of the dispenser.
4. Pull the dispenser head up slowly until it stops. The more dense or viscous the solution is the slower you need to go and even hold it at the top.
5. Slowly press the dispenser head down with the container under the tip until it stops and wait until liquid stops coming out.
6. Check to make sure the volume transferred is about what you wanted.
For a dispenser with spring loading refilling you can skip step 4. We will do a quick rough check of the dispensers using a 10 mL graduated cylinder. The pump dispenser bottles are filled with RO water and will be set to deliver 2, 5, or 10 mL. Write down the volume the dispenser is set for. Now transfer this volume into an empty 10 mL graduate cylinder and record the volume to ±0.1 mL. Repeat if the volume is not consistent with setting on the dispenser and see your TA if the volume delivered is off by more than 0.2 mL for two or more trials. Repeat this with the other type of pump dispenser. The calibration of bottle top dispensers by measuring the mass of water transferred as was done with the pipets can be done if a more accurate calibration is needed but is not necessary for this experiment. Record your data for the bottle top dispensers on your report sheet.
Pipettors
Today pipettors are standard in research and industrial labs for transferring volumes from 0.0005 to 10 mL and their use is a required skill for this lab. For volumes less than about 2 mL they are the best way to precisely transfer liquids quickly. Volumetric pipets are still more precise for larger volumes but they are much slower to use. The problem with pipettors is that the calibration or volume delivered is easily affected by misuse or solution properties. Since many students use the 5 mL pipettor at your work station, the calibration must be checked every lab period it is used. Another huge advantage of pipettors is that only the removable/disposable tip comes in contact with the solution transferred if the pipettor is used correctly. Users in the areas of biochemistry or microbiology will generally use a tip only once to prevent contamination of samples. Since we are not worried about microbial contamination and are using only aqueous solutions (water as the solvent) we will reuse tips and wash them after every use.
To check the calibration of the 5mL pipettor at your work station we are going to modify the calibration procedure slightly but first let's review the steps for using pipettors. Using an automatic pipettor makes transferring precise volumes of liquids easy, but the procedure must be followed exactly. Always calibrate the pipettor with RO water to check technique and pipettor calibration before using one. The following are general steps for using a pipettor:
1. Select the correct pipettor that best matches the volume to be transferred. Never go above or below the working volume range for a pipettor (1-5mL for 5mL pipettor at your workstation).
2. Dial in the volume wanted and snuggly place the correct and clean plastic tip on the pipettor. Be sure to clean the plastic tip for each new solution transferred. Never use a pipettor without a tip!
3. Depress the plunger button to the first stop, put the end of the tip in liquid, and slowly let the plunger button up to draw liquid into the tip. Wait for 5-10 seconds (keep the end of the tip in liquid at all times while liquid is drawn into the tip). Keep the pipettor tip pointed down at all times! Remove the tip from the liquid. (Note: If, at this point you notice droplets appearing and falling off the tip stop the transfer, reset the tip on the pipettor, and start over. If it still leaks see your TA).
4. Point tip into container you want to transfer to. Now press the plunger button all the way down (past the first stop) and wait. This procedure may need to be modified for very viscous or dense liquids.
5. Hang the pipettor on its holder or remove the tip before setting the pipettor down (Always keep tip pointed down until it is removed from pipettor).
To calibrate the pipettor we will do at least four trials. Place about 40 mL of RO water in a 100 mL beaker. Working by a balance follow these steps to check the calibration of the pipettor:
1. Set the 5mL pipettor on 5.00mL and place a tip on it.
2. Place the 50 mL beaker on the balance and tare it to zero.
3. Take the 50 mL beaker off the balance, transfer 5 mL into the beaker as noted above and immediately place it back on the balance and record the mass on your report sheet. (There is no need to dump water out of the beaker.)
4. Tare the beaker on the balance to zero, remove it from the balance and transfer another 5 mL into it.
5. Place it back on the balance and record the mass.
6. Repeat steps 4 and 5 until you have at least four consistent masses of water recorded on your report sheet.
7. Measure the temperature of the water and calculate the volumes from the masses using the density of water at that temperature. Calculate the volume error by subtracting each of these volumes from 5.00 mL. If the error in volume is greater than ± 0.05 mL, you have either made a pipetting error, your pipettor is dirty or damaged, and/or the calibration of your pipettor is off. In any case, get some help from your TA and they will help you repeat the calibration check and see how to proceed.
Notice that the volume calculated from the mass is just slightly larger number by about 0.01. When you check the calibration of your pipettor set at 5.00 mL later in the semester do one calibration and look at the mass. If it is within 4.94-5.04g the pipettor is good to use as long as it is not leaking. If it is outside this range do more calibration checks and see your TA if you consistently get the same high or low mass/volume transferred.
Fermentation of Apple Juice to Cider – Second Week (Group Work–data collection only)
After 1 week the fermentation should be complete. Record observations and remove the balloon and rubber band or twist tie from the flask which now contains cider and immediately weigh it. Make sure the outside of the flask is clean and dry. You will notice that the mass is now different than the starting mass. Next measure the volume of the cider with a 10 or 25 mL graduated cylinder (depending on the volume of cider). When you are done for the day, wash all glassware used. Clean your work space and any other areas you used in the lab. Make sure your workstation drawer is complete and ready for the next student. Use the equipment list posted in from of your workstation.
Please note that all calculations are done individually not as a group. Calculate the mass of cider and its density using its mass and volume. The mass of carbon dioxide made during fermentation can be determined by subtracting the “Mass(g) Flask+Yeast+Apple Cider” from the “Mass(g) Flask+Yeast+Apple Juice”. Compare this value to the predicted mass of CO2 made answering the second post lab question.
Using the mass of CO2 made, the percent alcohol in the cider can be determined. By first calculating the moles of CO2 and then knowing that for every one mole of CO2 made, one mole of ethanol will be made according to the chemical equation. The mass of ethanol made can then be calculated and using the total mass of cider, the percent alcohol in the cider can be found and compared to values for alcoholic beverages found in the store or on the web. The concepts of stoichiometry needed to do this calculation will be covered later in lecture but for now the calculation can be done as follows.
Percent Ethanol=104.7(MC/MT) that is simplified from this calculation:
![]()
where MC is the mass of CO2 made and MT is the total mass of cider made.
Each group will decide on values to report for class data for their work to further investigate the effect of mass of apple juice and mass of yeast on the fermentation reaction and compare the densities of apple juice and apple cider for each group. The TA will have a spreadsheet up on the computer connected to the projector for each group to enter agreed values on the class spreadsheet for your lab section. Enter the data called for on this spreadsheet. You will use these results to individually answer the post lab questions the last page of your report sheet. Use a separate sheet of paper if needed. Do the required calculation checks. Have your TA or instructor review and sign your results for parts A-C to make sure you have mastered these techniques and completed the required work. Any optional work can be added for extra credit.
The fermentation report sheet will be stapled to the other report sheet for experiment 1 along with printouts of graphs or calculation checks you did. Sheets containing optional work must be done individually for extra credit and stapled to the report sheet. Record key values from the report sheet in the space provided on the next page or make a copy of all your results before you submit it for grading in case the report sheet is lost. The chemistry department is not responsible for lost papers.
As an optional part of this experiment to explore the rate of reaction, you can weigh the flask setup now, at least twice during the week, and then on your next regular lab period recording the date when the mass was measured and recorded. Record these masses when other sections are meeting. See the syllabus for lab times. Immediately return the flask setup to the cabinet for your section when you are done weighing it and taking observations. For another optional challenge, calculate the volume of CO2 in mL that should have been collected using the mass of CO2 made and compare this to the estimated volume of gas in the balloon at the end.
Instructions for Graphical Analysis (Note - all graphing work is done individually):
“Graphical Analysis”, a program by Vernier is loaded on all computers on the second floor of building 17 as well as all computers in CEFNS student computer labs. You can also use excel to graph data for this experiment if you choose. To start graphical analysis click on the “windows globe” in the lower left of your desk top, then “All programs”, then “chemistry applications”, and finally “graphical analysis”. The program is easy to use. From the class data table simply enter values in the “Data Set” table on the left side of screen. For this experiment you will enter the mass (g) of apple juice in the x column (for x axis) for all six groups (going from lowest to highest mass of apple juice) entering the corresponding mass (g) of carbon dioxide lost in the y column. The data will be plotted as you enter the x-y pairs.
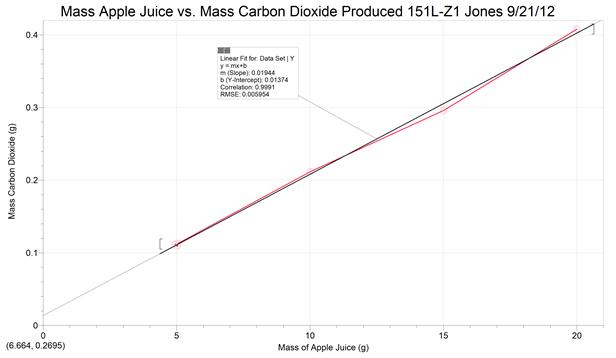
Once the data is entered a linear regression (or fit) is done by clicking on data in cell x1 of the “Data Set” table and dragging down to the bottom cell in the y column. Next click on the “Linear Fit” icon (second from right on top function bar) and the linear fit data will appear on the screen with m (slope), b (y-intercept), and Correlation (correlation coefficient for the linear regression). Record these values in your postlab questions. The closer the correlation coefficient is to one the more linear the data. Next double click on the graph to enter a graph title that will include your name, section, and date. To label each axis double click on the “x” or “y”. Print the graph. Now enter data using the mass of yeast instead of apple juice again entering the lowest mass of yeast first with its corresponding value of mass (g) of carbon dioxide lost in the y column.
References
1) Williamson, Kenneth. Macroscale and Microscale Organic Experiments. 2nd Ed. D.C. Heath and Company. 1994, 594-604.
2) Cider making. [Online] Available: http://web.bham.ac.uk/GraftonG/cider.htm
Record Key Data From Your Report Sheet Below As a Backup:
Mean Density of Unknown Metal Bar ___________g/mL for Unknown # ________ (stamped on metal bar)
Volumetric Pipets Mohr Pipet Graduated
Volume Used 10 mL 5 mL 10 mL Cylinder Beaker
Calculated Volume (mL) __________ _______________________ _________ _______________
Volume Error (mL) ___________ __________ ____________ _____________________
5mL Pipettor: Temp.______(ºC) Trial 1 Trial 2 Trial 3 Trial 4
Mass of Water (g) ______ ______ ______ ______
Calculated Volume of Water(mL) ______ ______ ______ ______
All fermentation data should be immediately recorded by each group member.
Do not remove this page from you lab manual! Turn in the report sheets to your TA.
Name_________________________________ Student ID#______________ Dana ID______
Lab Section Letter______________ Workstation #_________________ Date____________
Experiment 1: Measurement of Mass, Volume, and Density and Fermentation
Outline of Experimental Procedures (due before starting experiment!): __________________________
_______________________________________________________________________________________
_______________________________________________________________________________________
_______________________________________________________________________________________
_______________________________________________________________________________________
Risk Assessment (due before starting experiment!): ___________________________________________
TA’s signature for completing outline and risk assessment on time:______________________________
Experimental (all individual work, no group work or sharing data!)
Part A Calibration (Use calibration weights by balances). Mass stamped on weight_________________ g.
Measured mass______________________ g Difference in Mass____________g
Part B Density Metal Samples Metal Sample Used: Al Cu Cu (write new
procedure below)
Mass of metal sample (g) _____________ _____________ _______________
Volume of water (mL) _____________ _____________ _______________
Volume of water & metal sample (mL) _____________ ____________________________
Volume of metal sample (mL) _____________ _____________ _______________
Density of metal sample (g/mL) _____________ _____________ _______________
Which density is more accurate, Al or Cu?_____________________________________________________
What measurement makes calculating the density of Cu difficult? Why?_____________________________
_____________________________________________________________________________________
Write a new procedure to determine Cu density and then do it (see 3rd column above):___________________
_____________________________________________________________________________________
Density of Unknown Metal Bar
Density of Unknown Metal Bar – Unknown # _____________ (stamped on metal bar)
Trials 1 2
Mass of metal sample (g) _____________ _____________
Volume of water (mL) _____________ _____________
Volume of water & metal sample (mL) _____________ _____________
Volume of metal sample (mL) _____________ _____________
Density of metal sample (g/mL) _____________ _____________
Mean or Average Density of Metal Bar (g/mL) ________________ Range____________
Please note that copies of calculation checks for “Density of Solids” (Density Metal Samples) & “Density of an Unknown Solid” (Unknown Metal Bar) must be completed, printed, & stapled to this report sheet.
Part C (Calibration Checks)
Temp. of Water ________(ºC) Density of Water _____________g/mL (see water density table on p.25)
The density of the water is used to determine the "Calculated Volume" or actual volume delivered below.
Size of Glassware→ 10mL 5mL 10mL 25mL 50mL
Volumetric Pipets Mohr Pipet Grad.Cylinder Beaker
Volume to Transfer→ 10.00 mL 5.00 mL 10.00 mL 10.0 mL 10 mL
Mass Vial (g) ____________ ___________ ____________ ___________ ___________
Mass Vial & Water (g) ____________ ___________ ____________ ___________ ___________
Mass Water (g) ____________ ___________ ____________ ___________ ___________
Calculated Volume (mL) ____________ ___________ ____________ ___________ ___________
Volume Error (mL) ____________ ___________ ____________ ___________ ___________
Volume Error = Volume to Transfer - Calculated Volume The error shouldn’t exceed ±0.05mL for volumetric pipets or 0.2mL for the Mohr pipet; if too big repeat the procedure or see the TA.
Do the Error in Glassware calculation check for the data above, print it & staple it to this report sheet.
Bottle Top Dispensers: Non spring loaded refilling Spring loaded refilling
Volume Dispensed (mL) – Dispenser set to: ____________ ____________ (2, 5, or 10 mL)
Calibration with 10 mL graduated cylinder:
Volume Measure (mL) ____________ ____________
Volume Error (mL) ____________ ____________
(Volume dispensed minus volume measured, should not be more than ±0.2mL)
Pipettor Calibration: Temp. of Water ________(ºC) Density of Water _____________g/mL
Use 5 mL pipettor set to 5.00mL Trial 1 Trial 2 Trial 3 Trial 4
Mass of Water (g) ____________ ___________ ____________ ___________
Calculated Volume of Water (mL) ____________ ___________ ____________ ___________
Volume Error of Water (mL) ____________ ___________ ____________ ___________
(5.00mL minus Calculated Volume, should not exceed ±0.05 mL)
Post Lab Questions for Part C:
1. From your data for part C above, which glassware is most accurate? Least accurate?
2. Look at volume error. What effect does glassware diameter at calibrations have on volume error?
3. What glassware is slowest to clean and use? What aspect of design makes it precise and/or accurate?
4. (4pts) Choose the best glassware/pipettor (& size in mL) tested above to transfer each of the following volumes in one transfer:
21.0 mL_____________________________________ 8.68 mL___________________________________
10.00 mL_____________________________________ 5.00 mL_________________________________
40 mL________________________ 3.15 mL____________________ 88 mL_______________________
Name_________________________________ Student ID#______________ Dana ID______
Lab Section_________ Workstation #______ Date________ Your Group Number__________
(30 pts) Experiment 1: Fermentation Data, Results, and Post Lab
Group Data – Raw Data from group but calculated values done individually:
*This number is a calculated value.
|
Mass Range of Yeast - p. 23 |
|
|
Volume of Apple Juice Used (mL) - p. 23 |
|
|
First period of experiment 1 |
|
|
Mass Flask (g) |
|
|
Mass Flask + Yeast (g) |
|
|
Mass Yeast (g) * |
|
|
Mass Flask + Yeast + Apple Juice (g), no balloon |
|
|
Mass Apple Juice (g) * |
|
|
Density (g/mL) of Apple Juice (mass/volume) * |
|
|
Predicted Mass of CO2 made (calculated, p. 23)* |
|
|
Second period of experiment 1 |
|
|
Mass Flask + Yeast + Apple Cider (g), no balloon |
|
|
Volume Apple Cider (mL) |
|
|
Mass Apple Cider (g) * |
|
|
Density(g/mL) Apple Cider * |
|
|
Mass CO2 Made (g): mass lost making cider * (Mass Flask + Yeast + Apple Juice) – (Mass Flask + Yeast + Apple Cider) |
|
|
Percent Alcohol (see p.29 for equation) * |
|
How does your Percent Alcohol compare to other alcoholic beverages?
Class Data - Results From Groups 1-6:
|
Your Group Number |
1 |
2 |
3 |
4 |
5 |
6 |
Control (water) |
|
Mass Yeast (g) * |
|
|
|
|
|
|
|
|
Mass Apple Juice (g) * |
|
|
|
|
|
|
|
|
Density (g/mL) of Apple Juice (mass/volume) * |
|
|
|
|
|
|
|
|
Density Apple Cider (g/mL) * |
|
|
|
|
|
|
|
|
Mass CO2 Made: mass lost (g) * (Mass Flask + Yeast + Apple Juice) – (Mass Flask + Yeast + Apple Cider) |
|
|
|
|
|
|
|
FERMENTATION: Complete these post lab questions (All answers must be done individually!)
1. Using the class data for the densities of apple juice, calculate the following.
Average:
Median:
Range:
Comment on the precision of the data:
2. Using the class data for the densities of apple cider, show calculations for:
Average:
Median:
Range:
Comment on the precision of the data:
3. Use data for groups 1-6 for the following (Use graphical analysis to plot data):
a. Graph or plot “Mass of CO2 Made” (y-axis) versus “Mass Apple Juice” (x-axis), do a linear fit (regression), record the following information.
Slope:________
Y-Intercept:___________
Correlation Coefficient:__________
b. Graph or plot “Mass of CO2 Made” (y-axis) versus “Mass of Yeast” (x-axis), do a linear fit (regression), record the following information.
Slope:_________
Y-Intercept:___________
Correlation Coefficient:__________
c. Which graph looks more linear? Explain how the correlation coefficient would support this observation. In which graph is there a direct relationship between the variables (If you double one the other would also double).
d. According to the class data, does increasing the mass of apple juice affect the amount of carbon dioxide produced? Why or why not?
e. According to the class data, does increasing the mass of yeast affect the amount of carbon dioxide produced? Why or why not?
4. Why might the Predicted Mass CO2 differ from the Mass CO2 Made?
Experiment Two: Identification and Quantization
Of a Metal Chloride Salt
Purpose: Do multiple simultaneous trials to measure the density and concentration of a metal chloride salt unknown assigned to you using techniques mastered in experiment one. A flame test will then be used to identify the metal cation in the chloride salt so the molar mass can be calculated and used to calculate the molarity. The average, median, and range for the molarity will be reported.
Required Techniques and Concepts: Quantitative transfer using a pipettor or volumetric pipet and use of balance mastered in experiment one will be used in conjunction with heating on a hot plate to determine concentration. Mastery of qualitative handling of solutions avoiding contamination and flame test to identify metal cations is expected. Safely using a Bunsen burner and hot plate for heating. Density, percent by mass, concentration, molar mass, moles, and molarity will all be calculated using unit cancellation and reporting results to correct significant figure to express precision correctly. The average or mean, median, and range will be calculated for the molarity.
Background: A large "boom" followed by bright streamers of light and sparks of every color is a familiar sight every July 4th. The fantastic displays of color and light generated by fireworks have captivated audiences since the Chinese developed the first ones more than 1,000 years ago. The various colors of fireworks are caused by different atoms or molecules such as aluminum atoms, which absorb energy (heat) and then release this energy as light. Atoms or molecules of an element or compound will emit a characteristic color of light after being excited. The color of light emitted by a substance can then be used to detect and identify elements or compounds it contains.
Quantitative measurement skills from experiment one will be used to determine the density, percent-by-mass, concentration in g/mL, and molarity once a flame test is used to identify the metal chloride in an unknown solution provided for this experiment (in an unknown packet). The mass and volume of three samples of the solution will be measured and then heat from a hot plate will be used to remove the water from each sample to determine the mass of salt in each. If the volume and mass of solution and mass of salt are known along with the identity of the metal chloride salt all the values can be calculated.
Referring to the experiment 2 report sheet the “Mass of salt in solution (g)” is calculated by taking the lowest “Mass: flask+stir rod+salt” after heating and subtracting the “Mass of empty flask & stir rod” from it. Using this mass the “Moles of salt in solution” is calculated using:
![]()
Calculate the molar mass of the metal chloride salt you identified using the flame test on your unknown. See your TA if you have questions about calculating molar mass. The moles will be used later to calculate molarity.
Density is a characteristic physical property of matter that can be used to help identify a substance. The density of any given substance or object refers to its mass per unit volume. It is mathematically expressed as and commonly has units of grams per cubic centimeter (g/cm3) or its equivalent, grams per milliliter (g/mL). For this experiment the solution refers to the unknown you used for this experiment.
![]()
Concentration describes the quantitative composition of a uniform or homogeneous sample of matter such as a solution. Concentration can be expressed in many ways depending upon the situation and the scientific or professional area. A common way to express the concentration of a homogeneous mixture or solution is by percent-by-mass composition (w/w). Percent is the part divided by the whole times 100. For example for a solution, the concentration of a sterile 0.9% saline solution is expressed using percent-by-mass and is commonly used in medicine. There would be 0.9 g of salt (NaCl) and 99.1g of water in 100.0g of 0.9% saline solution. For this experiment the:
![]()
The concentration of a solution can also be expressed using mass and volume. For this experiment the concentration of the salt in solution (unknown) is:
![]()
Molarity (M) is another example of how concentration is commonly expressed in chemistry. The molarity of the salt in your unknown can be calculated as follows:
![]()
Be sure to convert the volume from mL to liters. Calculate these values for each of three trials and then calculate the median, mean, and range for the three molarity values.
As the concentration of the salt in the unknown is determined by removing the water from precisely measured trials the next objective of this experiment will be to investigate the colors emitted by metals in solution when heated in a flame. The metals will be present in the form of metal chloride salts in an aqueous (water) solution. Some of these metal salts are used in fireworks to generate the fantastic displays of color. Once the color emitted by each metal salt in a set of “knowns” has been carefully observed, the observations will be used to test for the presence of these metal salts in common substances. The identification of which metal salt is present in the unknown assigned to you will then be determined allowing for the calculation of molar mass and so moles of salt and molarity of the solution. The ability to identify the elements, or compounds present in substances based on their physical or chemical properties is of key importance to chemists and other scientists. Be sure to see the two videos on this experiment on the CHM151L homepage.
The Experiment (Individual Work Only)
Risk Assessment: Low to moderate. The unknowns are prepped in a very dilute solution of hydrochloric acid with a pH of about1-2 to prevent bacterial growth and so have a baker hazard code of 2012. Goggles are therefore required for this experiment. Barium chloride solution (0.2M) has a baker hazard code of 2001. The Bunsen burner is a fire and burn hazard and the hot plate and heated flasks/stir rods are also burn hazards. Hot flasks cannot be put on the counter tops, instead white heating pads must be used for the flasks.
Equipment and Supplies Needed: Bunsen burner, hot plate, three 125 mL Erlenmeyer flasks and three glass stir rods, 5mL pipettor or volumetric pipet, eight test tubes and test tube rack, nichrome wire with small loops, and the unknown for experiment two (2-xxxx) with a 2012 Baker hazard code. Known solutions of metal chloride salts used are dissolved in RO water to form 0.2M solutions are provided in bottles with droppers or pump dispensers the laboratory room.
|
Chemical Name |
Formula |
Baker Hazard Code |
|
barium chloride |
BaCl2 |
2001 |
|
calcium chloride |
CaCl2 |
1010 |
|
copper (II) chloride |
CuCl2 |
1001 |
|
potassium chloride |
KCl |
1000 |
|
lithium chloride |
LiCl |
1001 |
|
magnesium chloride |
MgCl2 |
1000 |
|
sodium chloride |
NaCl |
1000 |
Quantization of the Metal Chloride Salt in the Unknown
The unknown for this experiment is in your unknown packet. The unknown will be in a bottle with the number: "2-xxxx" where "2" is the experiment # and "xxxx" is the unknown number (a number from 1 to 9999). The HC-xxxx at the bottom of the label is the hazard code. Your TA will check out an unknown packet to you if you have completed the lab performance contact, MSDS tutorial certification, assignment one, and finished experiment 1. The unknown packet will be stored in your area in the student materials drawer for your section and workstation. Write your name, section, and work station on your unknowns as they are used so label two now.
Note: Keep the cap on the bottle at times except when sampling or pipetting to prevent evaporation. Any solution of an exact concentration should always be kept capped or stoppered to prevent evaporation.
In this part of the experiment you will use the following notes to outline an experimental procedure used to determine the moles, density, percent by mass, concentration (in g/mL), and molarity (in mol/L) of the aqueous solution of the metal chloride salt (your unknown) that you will identify in the next part of the experiment. Three trials will be done simultaneously. Using pen to record all of your data and observations directly on the report sheet at the end of this experiment (Never use paper towels, etc. to record data).
Caution: Do not place hot objects such as flasks on bench top. Instead use a white hot pads or clean ring stand base to cool hot objects! The unknown contains a very dilute solution of HCl to inhibit the growth of algae and bacteria. Avoid breathing the vapors released while you are heating samples of your unknown. The Baker hazard code for your unknown is 2012. Wear goggles at all times in the laboratory.
Note: First wipe down the hot plate with a clean damp sponge and dry it with a paper towel just in case the previous student spilled on it. You will need to start heating three 125mL Erlenmeyer flasks, labeled 1, 2, and 3 with a pencil, immediately at the start of class. Each will have a glass stirring rod as part of the apparatus. You must finish the quantization part of the experiment within one lab period. See your TA if you are not going to finish. In order to use your time efficiently you can start the flame tests while you are waiting for flasks to heat and cool if you wish.
1) In order to calculate the molarity, you must use the identity of the salt in the unknown determined by flame test so that the metal chloride salt's molar mass can be calculated. The flame test will be done the second week of this experiment.
2) Weigh three dry, room temperature erlenmeyer flasks with a glass stirring rod in each to start the procedure. (Each flask needs its own stir rod). DO NOT use the same stir rod for different flasks. Before weighing the flask use a pencil to label the flasks 1-3 on the white part of the flask (do not use labels that can change mass with heating) and dry them. The flask/stir rod setups are dried by heating them on a hot plate set on 4-6 for about five minutes. Cool the setups to room temperature by using crucible togs to place them on the white hot pads.
3) Take into account the total volume of the unknown solution you have been given (~20 mL) as you decide what volume of your unknown (2-xxxx where "xxxx" is your unknown number) to use for each trial and how many trials you should do. An excellent sample size is 5.00mL for each trial (hint: look at the report sheet). What glassware or equipment would you use to transfer this precise volume of your unknown to the flask for each trial? Refer back to experiment one.
4) After adding the volume of unknown to each flask setup weigh and record the mass of each.
5) Heat the unknown solution while stirring frequently with the glass stir rod in the flask to prevent popping. Careful, the stir rod may be hot! The hot plate should be on a setting of about six. When the first solid appears turn the hot plate down to about 3 or lower (to prevent popping). After all the liquid is gone continue heating on a higher setting 4-6 until there is no condensation in the flask. Weigh the flask setup after cooling it to room temperature on a white hot pad but reheat it if condensation forms as it cools.
6) To ensure that the salt is dry, reheat for 5-10 minutes on the hot plate set at 4-6, cool, reweigh, and record the mass for the second heating. The difference between the first and second heating of a flask should be less than 0.01g. If not, do a third heating repeating this step.
8) Do not clean out your flask setups until you have calculated the mass of salt and had your TA check your calculations. The mass of salt should be repeatable between trials as should the mass of solution.
9) Once you have good data for mass of salt immediately rinse the flasks and stir rods several times with hot water and once with RO water. Hang these flasks on the drying rack(s) in your lab and put three dry flasks and the stir rods back in your workstation.
Make sure you rinse out any used pipettor tips or pipets several times with hot tap water and once with RO water before putting them back in your workstation.
Identification of Metal Chloride Salts Using a Flame Test
Since some of these metals may also be present in soap, in tap water, on your hands and on paper towels, any glassware used should first be carefully washed with a small amount of soap and water, then rinsed several times with hot tap water, and finally rinsed RO water from the plastic wash bottle in your workstation. Fill your wash bottle with RO water. Clean seven test tubes (but don’t dry them) and place about 0.3mL (5-6 drops) of each of the metal chloride solutions in separate clean test tubes and put about 25 mL of RO water in a clean small beaker.
The salt solutions are heated in the flame of a Bunsen burner. The source of heat in a laboratory is the same as that for most commercial and home uses: the burning of a natural gas (primarily methane, CH4). The burner is made of metal and consists of a stand, gas-inlet valve, cylindrical barrel and air collar (Figure 5).
CAUTION: The flame of the Bunsen burner is sometimes hard to see and can cause severe burns. Keep hands, hair, and clothes clear of the flame at all times. Tie back hair if need be. Turn off the natural gas valve immediately if the burner goes out and never leave a lit burner unattended. Immediately stop, drop and roll if your clothing catches on fire or smother the fire with lab coat, fire blanket, or cotton clothing.
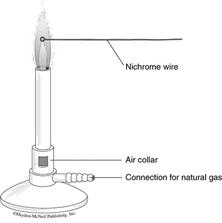
Figure 5. Bunsen burner and nichrome wire
Lighting the Bunsen burner: Attach the burner to the lab gas-valve outlet (blue cap) by a length of tubing. Close the air collar, slowly open the gas supply valve until your hear a flow of gas and immediately light the gas that is coming out of the burner with your flint-striker (new flints are available with TA or at the Stockroom). Slowly open the air collar until a luminous yellow flame is evident and adjust the gas supply valve to obtain a flame of the desired height. Continue opening the air collar and notice the change in the color of the flame. With optimum air intake, a blue, two part, nonluminous flame will be obtained (Figure 1). The gas flow can be used to slightly raise or lower the flame height.
Note: If you are color-blind, inform your TA before you start. To conduct a flame test of the metals in the salt solutions, obtain the nichrome wire from the reagent bench. The wire should have at least one small loop about 1/16 inch in diameter at the end of the wire. The wire should always be held on the end you are not heating. Rinse an end of wire with a loop in RO water and then hold the wire so the rinsed loop of the wire in the hottest part of the flame. Hold it there until no color is observed above the wire. Clean the last inch of the wire. The hottest part of the flame is at the tip of the inner cone (note position of the loop at the end of the nichrome wire in figure 5). The wire will glow red-hot when it is in the hottest part of the flame. Dip the wire in RO water and place it back in the flame. Repeat the process until only the blue color of the flame is observed. The wire must be carefully cleaned before each solution or sample is tested! What will happen if the wire is not cleaned between samples?
CAUTION: 6M HCl is corrosive. Avoid contact and wear your goggles.
If you have trouble cleaning the wire, place about 1 mL of 6 M HCl into a clean test tube and soak the wire loop in the acid. Heat the wire until it is red hot. Repeat this process until the wire is clean. Store the wire in the RO water. Never place your wire on the lab bench.
Now dip the loop of the wire in the solution of interest and place it in the hottest part of the flame. Carefully observe and note the colors, duration, and other special characteristics of the flame for each solution. Test each of the metal solutions provided, cleaning the wire between each test. Be aware that the wire and solutions are easily contaminated with sodium and that sodium will often be a contaminant in your tests. Pair up with another student in your lab who has completed observing the flames tests and compare data. Repeat tests that differ.
Next see if you can detect the presence of any of these metals in the environment around you. Test hot and cold water, sweat, and any other liquids you can think of for the presence of these metals. Test surfaces such as skin (make sure the wire is cooled in RO water before touching the wire), paper towels, the lab bench, or any other you can think of. What problem arises when you test "real world" samples? What metal contaminant have you observed in many of these samples? Identify the metal contaminants observed on your report sheet.
Now test the unknown for this experiment. Sample the unknown by placing the clean wire loop in the unknown solution in the bottle (don’t transfer to test tube).
Color-blind or partially color-blind students will need to work with a lab partner, but each student must test their own unknown. Don’t share unknowns. Once you have identified your unknown, run a side-by-side test: Retesting the known reagent solution that has the same metal that you think is in your unknown solution, and then testing your unknown again should confirm the identity of your unknown. If the compounds are the same there is no reason to clean the wire when running the side-by-side test. Be aware that there may be contamination in your unknown. If there is a contaminant, note the identity on your report sheet. The intensity of the color emitted by the contaminant will be less than the color emitted by the metal in your unknown. Used chemicals from this experiment may be flushed down the drain with tap water. Wash any glassware used and return the clean Nichrome wire to the reagent bench and the test tubes and other equipment to the correct location in your workstation glassware drawer and locker bin. Note the unknown number and identity of your unknown (salt) below and complete the report sheet. Store your unknowns in your student space storage drawer along with your goggles. Write your name on your goggles with a marker.
Once the report sheet is completed, make sure your full name, student ID#, lab section letter, workstation #, and unknown number are neatly printed on the report sheet. Without this information your paper may not be graded or it could be lost. You must complete the web based calculation checks for experiment 2. Printout a copy of the calculation check and staple it to the report sheet along with any procedure notes. These items must be attached to your report sheet for it to be graded. The unknown number, identification, and molarity for your unknown must be recorded below in case your report sheet is lost. The report sheet should be turned in to your TA for review.
Fill in the following data from your report sheet or make a copy of the report sheet before you turn it in for grading just in case it is lost:
Quantization of Unknown Salt Solution (2-xxxx):
Trials (1) (2) (3)
Volume of solution used (mL) ______________ _______________ ______________
Mass of empty flask (erlenmeyer) & stir rod (g) ______________ _______________ ______________
Mass of flask, stir rod and solution (g) ______________ _______________ ______________
Smallest Mass of flask, stir rod & salt after heating____________________________ ______________
Molarity (mol salt/L) ______________ _______________ ______________
Median Molarity (mol/L) ___________________ Range (mol/L)__________ Average (mol/L)_______
Flame Test on Unknown (bottle with 2-xxxx)___________________ Identity_________ Unknown # _______
Also list any results for repeats below:
Name____________________________ Student ID#________________Dana ID______
Lab Section______ Workstation #________ Date__________ Unknown #___________
Report Sheet - Experiment 2: Quantization and Identification of Metal Chloride Salt
Outline of Procedure (Due before starting experiment! Be sure to note how the unknown will be transferred to flask):
____________________________________________________________________________________
____________________________________________________________________________________
____________________________________________________________________________________
Risk Assessment (due before starting experiment!):___________________________________________
_______________________________________________________________________________________
Have TA sign for procedure before continuing__________________________ Date_______________
* These values will be calculated after the salt is identified by flame test.
Molar Mass of Metal Chloride Salt in Exp.2 Unknown______________________ g/mol *
Quantization of Unknown Salt Solution:
Trials (1) (2) (3)
Volume of solution used (mL) ______________ _______________ ______________
Mass of empty flask (erlenmeyer) & stir rod (g) ______________ _______________ ______________
Mass of flask, stir rod and solution (g) ______________ _______________ ______________
Mass of solution (g) ______________ _______________ ______________
Mass of flask, stir rod & salt after 1st heating (g) ______________ _______________ ______________
Mass of flask, stir rod & salt after 2nd heating (g)______________ _______________ ______________
Mass of flask, stir rod & salt after 3rd heating (g) ______________ _______________ ______________
(needed only if difference between 1st & 2nd >0.005g)
Mass of salt in solution (g) ______________ _______________ ______________
Moles of salt in solution (mol)* ______________ _______________ ______________
Record to 0.00001 (3 significant figures) or more
Density of solution (g solution/mL) ______________ _______________ ______________
Percent by mass of salt ______________ _______________ ______________
Concentration (g salt/mL solution) ______________ _______________ ______________
Molarity (mol salt/L) * ______________ _______________ ______________
Median Molarity (mol/L) *_________________ Range (mol/L) *_________ Average (mol/L) *________
Are your results precise?_________ Why or why not:__________________________________________
___________________________________________________________________________________
List possible sources of error for this experiment:_____________________________________________
______________________________________________________________________________________
Have you done a calculation check? (Yes/No)______ If not, do one and print it and attach it to this sheet before turning it in.
Identification of the Metal Chloride Salt by Flame Test
Outline of Experimental Procedure for Identification of Metal Chloride Salt (due before starting experiment!):
_________________________________________________________________________________________
_________________________________________________________________________________________
Flame color(s) and associated intensity,
time for onset of color(s), duration of
Known Compound color(s), and other observations.
BaCl2 _________________________________________
CaCl2 _________________________________________
CuCl2 _________________________________________
KCl _________________________________________
LiCl _________________________________________
MgCl2 _________________________________________
NaCl _________________________________________
Flame color(s) and associated intensity,
time for onset of color(s), duration of Identity of metal salt
Samples to Test color(s), and other observations or salts present.
RO water _______________________________________ __________________
Cold tap water _______________________________________ __________________
Sweat/Skin _______________________________________ __________________
Other _______________________________________ __________________
Unknown (bottle with 2-xxxx) _______________________________________ __________________
Now redo the following tests to confirm identification of unknown by comparing flame test of the known solution from reagent bench that matches your unknown (this is call a "Side-by-Side" test):
Known Metal Chloride Solution _______________________________________ __________________
(Retest known solution from reagent bench)
Unknown Metal Chloride Solution _______________________________________ __________________
(Immediately retest your unknown to compare to the test with the known solution)
Identity of the Unknown Metal Salt______________________________ Unknown # _________________
If there is a contaminate in your unknown list it here: _________________________________________
What is the problem with using a flame test for "real life" samples? _______________________________
What contaminate was found in many of the samples?_______________________________________
Copy this report sheet or fill in the blanks on p.42 before turning in this report in case it is lost.