 |
Understanding Variables
- So far, research superstars, we've discussed how the research question (or problem statement) "drives" all other parts of the research plan (Figure 1 in your first module).
- Last time (Module # 2), we also learned that these research questions/problem statements can be sorted or grouped into "families." These families depend on:
- what you are trying to answer or find out;
- certain "keywords" in the problem statement or research question (e.g., "what is/what are," or identifying would imply a descriptive question/statement)
Next, we'll be zeroing in on these questions/statements and trying to identify the variables associated with our questions/statements.
- These variables will also be closely linked to our "scales of measure" (first module in Statistics), as we'll soon see!
***Click on the "sample solution set/extra examples" . Print this out and keep it handy for reference as you work through this module and particularly for review before you do Assignment #3!
- What Is a "Variable?"
Broadly speaking, a "variable" is a "target measurement"
or "outcome" of your problem statement/research question. Variables
are the "things" we're measuring, or collecting data (information)
on, or forming groups on, in order to conduct our research study and
answer our question(s).
This is why it's important to be able to identify the "key variables"
within our problem statement/research question.
Hopefully, this will become a bit clearer with some examples. But
first, let's take a moment to identify the distinction between a "variable"
and a "constant!"
- Variables vs. Constants
- A variable can also be thought of as something
whose value (quantitative or qualitative) can be different
for each research subject.
- A constant, on the other hand, always has the
SAME value (quantitative or qualitative) for each research
subject.
As an example, let's look at the following:
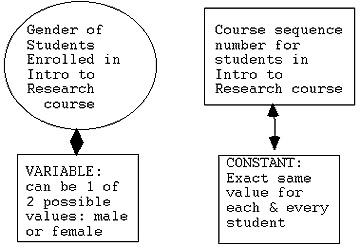
Do you see why, in the above, "Gender" (of students enrolled
in EDR 610, Intro to Research, course by modem, SS I) is a 'variable?'
It can 'vary' (albeit not very much ... only two possible
'values', but still .... !) from student to student: male or
female.
P.S. Can't resist a tie-in, statistics fans! Do you also see
how the variable of "gender" is nominally scaled
as well?
The numbers assigned to code in a student's gender are
strictly arbitrary and just labels! These numeric
codes "wouldn't mean anything as numbers!" Doesn't matter
if you decide to assign:
'1' for male and '2' for female; or
' 576' for male and '384' for female!
In contrast, our particular course sequence number in
EDR 610, SS I, Intro to Research is a constant! That's
because it stays exactly the same for each and every student
(research subject; research unit)! Again, don't ask me what
it is ... I'm just making this up ... let's say "31849"!
To sum up:
- A "variable" is something whose value can
vary from subject to subject;
- A "constant" is the same for each and every subject
(e.g., its value doesn't vary; it 'stays' constant)!
Side note: which of the two do you suppose are "more
interesting" as the "stuff of research questions/problem
statements?
Hope you said "variables!"
Since a constant is exactly the same for everybody, it doesn't
really spark our curiosity or tell us much, once we find out
what it is!
But variables are the things we try to understand: e.g., WHY
does reading comprehension vary so much for these first graders?
WHAT accounts for that variability? If I grouped them according
to "High," "Moderate," and "Low" support from parents for reading
in the home, let's say, would THAT help 'explain' it? WHAT can
I do to increase reading comprehension -- maybe try out a special
teaching method?! And so on and so forth!!!
Therefore: it is variables that we will be focusing our main
attention on in research questions/problem statements -- and
collecting data (information) on them -- and looking at how
they 'vary' to answer our research questions!
Now, let's look at some additional ways to look at variables
... !
- Variables Can Be Defined or Measured in More than One Way
How you choose to EXACTLY measure or define variables is
something called "operationally defining your variables." This
will depend on 'what it is you want to know, exactly, about this variable,'
which in turn comes from how you are using it in your problem statement
or research question.
We'll talk more about "operational definitions" two packets from
now.
For now, though, let me give you just one example.
Suppose you have the variable of "kind of school."
Admittedly, this is broad in nature and could, conceivably, be defined
or measured many ways!
For one thing, you could have:
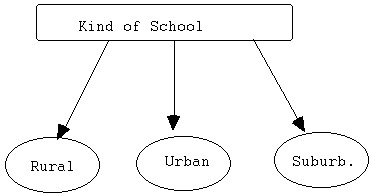
You'd want to define it this way if you think, say, that the region
might 'make a difference' on something you're studying.
Or suppose, instead, that you need and want to find out about the
level taught of each school, rather than the region in which it is
located. (Again, this would come from your research question or problem
statement.) In this case, you might have something like the following:
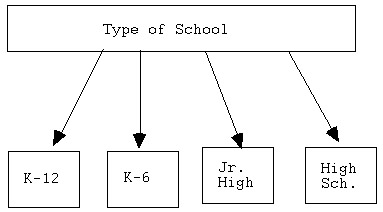
I realize that, in the above sample "mini-graphic," I didn't list
all the possible choices, or categories. This was just intended to
give you the general "gist" of the fact that the variable of "type
of school" can be defined in a totally different way (from the first
example, of 'region').
But just to digress for a moment, if you're defining a variable
by breaking it down into "subgroups," such as BOTH of the above 2
alternative definitions (e.g., "grouping by region" and "grouping
by level taught"), your grouping or coding categories need to
possess two (2) key properties; namely, they must be:
- mutually exclusive (that is, each 'unit' --
in this case, school, can go in one and only one grouping category
-- not overlap into 2 or more); and
- exhaustive (you must 'cover all the bases;'
that is, there needs to be SOME category that EVERY 'unit' gets
classified into -- even if it means ... ah, the bane of developing
'good' category codes!!! ... creating a 'catch-all' category like
"Other" or "Miscellaneous" if you absolutely need to!)
Finally, back again to the issue of "defining your variables in
potentially different ways," you could have instead needed or wanted
to measure the variable of 'type of school' according to its 'current
student population.'
One way to do this (& by the way, not a bad idea for practical
reasons to start with it THIS way even if you'll opt for the 2nd
possibility to be discussed shortly) is to collect the 'raw data'
by 'exact student population;' e.g.:
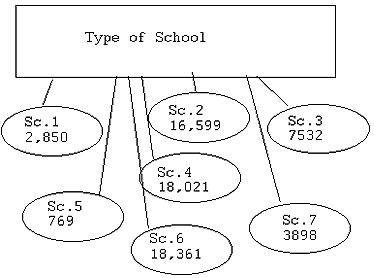
... and so on and so forth!
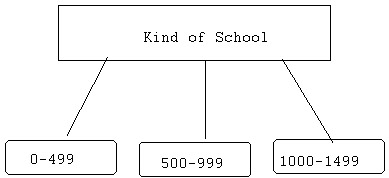
On the other hand, you could have chosen to define the "student
population" itself NOT in discrete or 'raw' values but by subgroups
or subcategories; e.g.,:
... & again, so on and so forth 'till you form all of your "mutually
exclusive & exhaustive" subgroups or categories (as per the "2 key
qualities" of making such groupings: please refer back to pg. 7!)
Now ... please take a moment & compare the 2 alternative forms
of defining "school population" again.
Do you see why I mentioned, back on pg. 7, that it's probably
a good idea to go ahead and code in the 'raw values' (exact student
population for each school) EVEN IF you think you'll really need
and want this information only by groups?
Suppose you START with the following ranges of grouping:
0 - 499;
500 - 999;
1,000 - 1,499 ... etc., etc.
BUT THEN LATER YOU CHANGE YOUR MIND! and you say, "That's way
too broad." I need the information broken down or categorized by
'smaller ranges' than that; e.g.,:
0 - 399;
400 - 799;
800 - 1,199; .... etc., etc.
Well, if you originally had the data or values in 'raw form,'
it'll be a breeze to recategorize them by computer into the new
smaller ranges! On the other hand, if all you did originally was
to collect the information from the sampled schools by your first
code (e.g., on a survey, "Please check off the one choice that best
describes your current student enrollment: (a) 0-499; (b) 500 -
999, etc.") ... then you'll be out of luck if you later change your
mind and try to regroup them in a different (especially 'smaller-range')
way!
OK ... I hope you've gotten the idea that many variables
can be defined in more than one way, depending on what you
want to know and why you want to know it!
The above examples of the different ways we 'played with' defining
'type of school' as a variable ought to lead in nicely into another
'set of labels' we can apply to many variables!
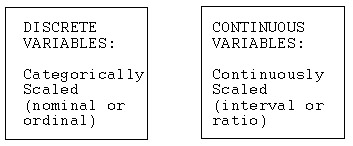
- Quantifiable variables can be defined as "discrete" or "continuous."
Ah -- method to the madness of that sometimes gol-darn frustrating
first Statistics packet on "Scales of Measure!"
That's because your practice in identifying and distinguishing among
the 4 types (nominal, ordinal, interval ratio) and the 2 broader "families"
(Nominal + Ordinal belong to "Categorical;" Interval + Ratio belong
to "Continuous!") will fit perfectly here!
Let's have a look now at discrete and continuous variables.
That's right! You first go back and identify which scale of measure
applies to that variable. Then you'll know whether it is "discrete"
(categorical) or "continuous" (same name!)
Just to review and practice:
- When we defined 'type of school' by its 'raw value,' or 'exact
current school population,' that would be ratio scaled (possible
'true zero;' school still under construction so no students go there
YET!) So ... that way, the variable of 'type of school' is also
a 'continuous' variable!
- On the other hand, when we subgrouped this current school population
into the ordered ranges of, say, "0-499," "500-999," and so forth,
do you see how that would be "ordinal" data (limited number of categories,
& some order -- e.g., size -- to those categories) -- which would
also make this a 'discrete' variable?
So... just to give some more examples:
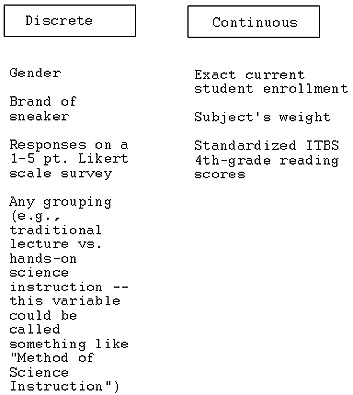
Please take a moment and convince yourself (using the "discrete
vs. continuous" graphic on pg. 10, and after classifying each of the
above into its scale of measure) why a given variable, above, is either
'discrete' or 'continuous!' (And of course, PLEASE don't hesitate
to ask your cyberspace Commander m.d. if you should have questions!
We'll successfully navigate you through 'em!)
Also, one reminder about the above 2 labels: the terms "discrete"
and "continous" apply ONLY to those variables that are QUANTIFIABLE.
They wouldn't be pertinent to QUALITATIVE (in words)
data or variables, such as "Teachers' attitudes towards unionization,"
IF this variable is being measured by interviewing teachers and recording
their attitudes in words.
This brings us to yet another way that many variables can sometimes
be labeled:
- Some variables can be defined as "independent" or "dependent"
in nature.
- These will apply to "experimental"-type studies. We've briefly
discussed some features of "experiments" in Module #2 (e.g., forming
groups such as "traditional lecture" vs. "hands-on science instruction";
doling out one or more treatments depending on these groups -- that
is, one group gets the 'treatment' of the hands-on science instruction
while the control group gets the traditional lecture method of teaching;
and trying to establish a 'tight control' over those other factors
which could creep in and contaminate the results of what we WANT to
assess or measure -- e.g., did the "type of instruction" affect or
influence master of basic science concepts?) We will be learning
more about experimental-type studies when we get into "families of
research design" a bit later on in the course! For now, if the
above summary gives you the 'general gist' of what an 'experiment'
is about, that'll do it!
For now, IF you DO have an experimental-type research question,
problem statement and associated 'experimental design,' you can
also label your variables as follows:
- The independent variable is the one you use
to form or "make" your groups. You'd give an overall
name or label to the independent variable, and each
subgroup that's contained within it is called a "level" of that variable.
Let's stick with the preceding example and hopefully this will
become clearer ...
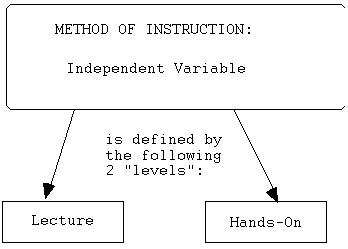
Please note, from the preceding example, that I thought up
an "overall descriptive label" for the independent variable
itself: "Method of Instruction." Next, I identified
each of its "levels;" that is, how many subgroups are
contained within it. And each level was named according to the
'distinguishing characteristics' of that subgroup (e.g., Level
# 1: "Traditional Lecture Method").
*** WARNING!!! It's easy to confuse the "independent variable
itself" with its "levels!!!"
In other words, it would be wrong to say, "The independent variable
in the preceding example is the hands-on method of science instruction."
That's only PART of it! or ONLY ONE LEVEL of the (TOTAL) independent
variable, "Method of Instruction!"
If this helps, the independent variable is like identifying the
whole forest, and the various trees, flora, fauna that together
make up that forest would be like its levels!!!
Now for the dependent variable:
- The dependent variable is the one that you
expect to change, or vary, as a result of the independent variable.
It might be thought of as the outcome. You'll
be measuring this outcome to see what effect(s) the independent variable
had on the dependent variable.
In the above experimental study example, we might envision holding
constant as many other factors as we can, and then making sure to
give the students in BOTH groups (traditional and hands-on instruction
methods) the SAME test of science achievement.
Therefore, in this case, the dependent variable would be "science
achievement." Again, it's the one we expect will 'vary,' or 'be
different,' as a result of the method of science instruction.
By measuring this dependent variable (and controlling for
as many other variables as possible; please see # 7, below, for
a label for THOSE!), we will get an indication of the relative
effect of the "method of instruction" (independent variable) upon
the target outcome of "science achievement" (dependent variable).
Please remember: the terms "independent" and "dependent" variables
are relevant ONLY for EXPERIMENTAL-TYPE studies.
You can also have MORE THAN ONE independent and/or dependent
variable in a given study. For instance, we might have defined
two dependent variables;
- Students' science achievement (as above; e.g., measured by a
standardized test); and
- Students' self-esteem (also measured by a standardized test).
- "Confounding" variables are those variables whose effects we
could not control for in our experimental study, and which might have
'crept in' to contaminate or influence our outcome (dependent variable).
In other words, we think/hope that if we do see a difference in
average science achievement scores -- let's say they're higher on
average in the hands-on instructional group -- that it's 'because
of' or 'due to' our independent variable of "method of instruction."
But suppose also that we haven't done as good and thorough a job
as we might have liked in anticipating and controlling for other possible
causal/contaminating factors!
Suppose, for instance, that we also happen to have twice as many
boys as girls in the hands-on instructional group! And that prior
research, theory, practice, etc., have consistently shown that boys
will tend to do better in science than girls at that particular age
regardless of methods of instruction.
Then: "Gender" has turned out to be a confounding variable.
Its effects have become 'confounded with' the effect of the independent
variable, "method of instruction," that we really intended
or wanted to study.
Finally ... we're almost home ... one more classification scheme
for 'variables!'
Research more information on confounding
variables and a couple more examples.
- In predictive studies (remember, 'prediction' is a special
case of 'correlation' where one 'thing' precedes the other and we use
information about the first to forecast or predict the second), we can
apply the terms "predictor" and "criterion" to the variables.
- The "predictor" is the first variable -- the one
we have information about and are 'using';
- The "criterion" is the second --the one being
predicted.
These are shown in the following example:

Remember: these labels only apply to those correlational
studies where there is such a time order or sequence!
If you'll remember the example of 'self-esteem' & 'academic achievement'
from Module #2, where they were CIRCULAR (each fed back on and affected
the other), for that example the terms would not apply (since they're
kind of in an 'endless loop' rather than one strictly leading into,
or being used to predict, the other).
Also, as with all of the preceding examples, you could possibly have
more than one predictor and/or criterion variable! Again, it depends
on your particular research question or problem statement!
- - -
WHEW!!! We've had quite a workout on variables today!
Let's see if we can summarize!
Summary Notes
- A variable is something that can take on different values
(quantitative or qualitative) for different subjects in a given
research study. A constant, on the other hand, carries the exact-same
value for all subjects in a study.
- Quantitative variables are:
- For experimental studies only:
Independent variables are "umbrella labels" for how
you've made your groups. Each "level" of that independent
variable would be a subgroup.
Dependent variables are the "target outcomes:"
the ones you expect to change as a result of the independent variables.
- Confounding variables are things/conditions/effects,
and so forth that you were unable to control for. Therefore they
'crept in and contaminated' the effects of your independent variable.
That is: you think it's the independent variable that "caused"
or "affected" your dependent variable(s) -- but actually, it
was partially or entirely the "confounder" that did so.
- For predictive studies (correlational with a distinct time
order or sequence to the variables): The predictor is the one
that "happens first;" The criterion is the one "being
predicted."
And in conclusion I can only say ...

Once you have completed this assignment, you should:
Go on to Assignment 1: Scales of Measurement
or
Go back to Understanding Variables
E-mail M. Dereshiwsky at statcatmd@aol.com
Call M. Dereshiwsky at (520) 523-1892

Copyright 1998 Northern Arizona
University
ALL RIGHTS RESERVED
|