|
EDR610
: The Class
: Good Measurement
: Part 3
: Lesson6-3-1
|
|||||||
| Validity and Reliability (Part III)
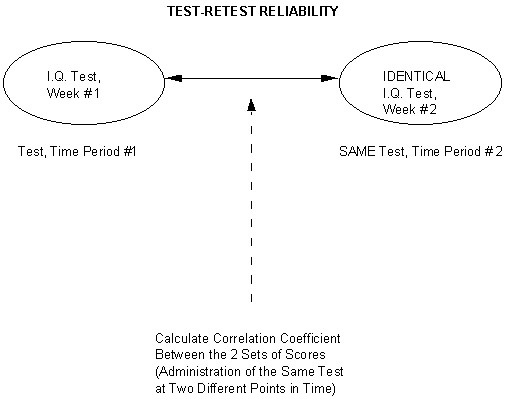
Also, another potential issue (if not a problem outright!) is "how long should the time interval be between the 2 test administrations?"
Well, we can rather effectively "knock out" the memory effect, at least! How about if we still give 2 tests to the same subjects -- only make the 2nd test NON-IDENTICAL to the first? That is ... have it be DIFFERENT questions in the SAME topic areas?! That is our 2nd way of assessing reliability!
2. Parallel Forms Reliability (also called Equivalent Forms Reliability) Now the second test covers the same general topics but is composed of different questions! In other words, it is "parallel" or "equivalent" to the first in terms of overall constructs or topics being measured -- rather than being "identical" in terms of specific questions! Example: a test of "math computation ability" given to a sample of 6th graders. If what is being tested is "long division" (four-digit numbers divided by two-digit numbers), simply make up different ones for the 2nd test! For example, "1453/26" vs. "8703/43". This not only eliminates "brute force memorization," but gives you a broader "look" at whether the kids can do the basic steps (subtract, bring down the next number, and so forth). In fact, thinking back on our last lesson packet (validity) for just a moment, some researchers even argue that this is a "good thing!" This is because by asking MORE and DIFFERENT questions on the SAME general topic (e.g., a broader sampling of having the kids do different "long-division" problems), they would say we are "more broadly sampling the overall 'content domain' of the "long-division" construct!" And thus, we are getting a more in-depth (and thus, valid) look at each kid's 'true ability' regarding this construct (than if we'd just repeated the SAME problems or questions on the 2nd test!) Let's look at the basic idea behind "parallel" (or "equivalent") forms reliability:
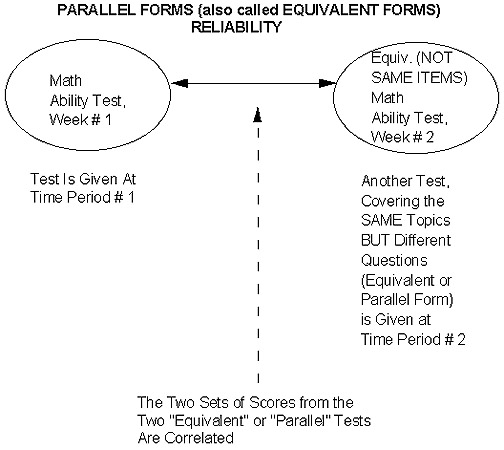 Now, the "challenge" here will be to ensure that the two versions of the test are indeed "equivalent" or "parallel" and that you haven't accidentally introduced some key difference or "subtle bias" (contaminating variable(s)) between the first and second versions of the test. This is where good, solid content and face validation (e.g., perhaps rigorous pilot testing, help from expert judges, and so forth) will come in handy. Soooo -- if we can do this, we have eliminated the "memory effect." However, with the same subjects still taking more than one test, we are still left with the "practice effect." But ... what if we give ONLY ONE TEST to a group of subjects (and thus, in their minds they're only taking a single test, one time), BUT "on paper" -- e.g., for our calculations -- we treat this one test as if it were two tests?! So long, practice effect! And that's the basis for the remaining two methods for assessing reliability! Actually, as we'll see, # 4 is just a "more general" case of # 3!
3. Split-Half Reliability
Let's look at a diagram of this process:
Again -- no practice effect! Since they think they only took ONE test, but for your (computational) purposes you have TWO test scores by splitting! Similar potential problem (to parallel forms): depending on how you split, you need to make sure that you really DO have two "equivalent" or "parallel" 1/2-tests! Ridiculous counter-example, but hopefully it makes the point ... suppose you have a 10o-item test of "computational aptitude." This construct is taken to mean facility with the four basic math operations: addition, subtraction, multiplication and division. You decide to calculate a split-half reliability coefficient on the scores. Furthermore, you decide to "do your split" by the first 50 items vs. the second 50 items. In other words, you correlate all the scores from the first 50 items with all of the scores from the second 50 items. But you forgot that you had some accidental bias built into the order and content of items: you had all the addition and subtraction questions in the first 50 items, and all of the multiplication and division questions in the second 50 items! Well .. then by splitting the way you did (first vs. second fifty items), you really aren'tcorrelating equivalentforms of the same overall test! And so you are likely to get a poor correlation coefficient, not because the whole test itself is "unstable" or "inconsistent" (e.g., "unreliable"), but rather because you aren't correlating two versions of the "same thing!" P.S. If you think back to our Population and Sampling Module, and specifically the discussion regarding systematic sampling (every "nth" off a list), you will recognize the above scenario as another case of that "periodicity" problem! That is: a bias or order effect built into the list -- and thus, a contaminating factor! One solution, then as now, would be to "jumble up" or randomize the list (in this case, questions) and then go ahead and take your first half vs. your second half -- with a greater likelihood that by randomizing you'll end up with more or less "equivalent mixes" of the 4 types of math operations in both halves of the test. Or ... you can split the 100 items some OTHER way into 2 subgroups of 50 apiece (e.g., odds vs. evens) -- again, making sure you haven't introduced some accidental bias or difference between the two halves. One other possible problem: if the original test is "short" to begin with, you're not really getting much of a "sampling" or "pool" of items in each half if you split that short test. There ARE a number of quantitative, statistical "correction factors" that you can apply to many of these "short splits." One of these -- I'll just introduce the name of it here, rather than go into the 'gory math,' is called the Spearman-Brown Prophecy Formula. (If you see it being reported in a research report, now you'll have seen the name and what it's supposed to be doing!) Now ... you might be thinking ... the above is convenient and easy to do -- but isn't it still highly dependent on how you did that SINGLE split (e.g., first half vs. second half; odds vs. evens; and so on and so forth)? With the advent of "lightning-fast calculating computers" and such -- what if you didn't do JUST A SINGLE SPLIT but rather SPLIT YOUR TEST (say, 100 items total) EVERY WHICH WAY (into 2 "piles" or subgroups of 50 items -- there's an equally 'gory' math formula for doing that -- and nope, I sure don't remember it off the top of my head! just wanted you to get the general "gist" of what it does and what we're doing here!)? AND then calculated a correlation coeffient (r) for EVERY SPLIT? AND finally, took the MEAN OR AVERAGE OF ALL THOSE CORRELATIONS ("the mean of all possible splits?!")?! Then you would be free of the "bias" of "only one single split and resulting correlation!" You're doing the splits EVERY WHICH WAY and then TAKING THE AVERAGE OF ALL THE "r's!" That's our 4th and last method of assessing reliability: the "more general case" of the SINGLE split in # 3!
4. Cronbach's Alpha (sometimes called Coefficient Alpha,, or even just Alpha!)
Now ... just one more "twist" to the tale. To apply the "pure" formula for Cronbach's Alpha, the "things" you're measuring have to be on at least a 3-point scale. But what if you have "dichotomous data" or measurements? Examples of these would be "yes/no," "correct/incorrect," "pass/fail," and so forth. There are two "cousins," or variations of Cronbach's Alpha for dichotomously scored data! You may have come across one or both of these names:
We've come a LONG way, particularly with the past 3 lessons! We started out by looking at "Two Key Properties, or Qualities, of Good Measurement" that our survey, test, interview guide, etc., should possess. These are validity and reliability. The first of these, validity, has to do with issues of credibility: Am I measuring what I think (hope?!) I am? Or have I instead picked up some unintended contaminating variable(s) in my measurement? Module # 9 looked more specifically at "4 1/2" ways to assess validity. The second, reliability, has to do with the consistency or stability of my measurement procedure. That was the topic of this final Intro to Research module. We examined 4 ways to assess reliability. Let's end this discussion on "ways to assess or measure reliability" by sort of "putting it all together" in a decision tree. (As you print out this decision tree, please check to make sure it "goes sideways.")
As we complete this phase of our glorious cyberspace journey, I'd like to extend to all of you my sincere "congratulations!" for a job VERY well done! You've been technological pioneers and groundbreakers in our course-by-modem advanced technological delivery system. Enthusiasm for this approach is at sky-high levels throughout CEE -- and I give YOU the credit for that. Your own enthusiasm, motivation, and scholarship have, without exception, been FIRST CLASS. I salute you and wish you much, much continued success and happiness in ALL your "journeys" through life! (Cyberspace and otherwise ... !) You're the GREATEST and I have been blessed to get to know and work with you all!
Once you have completed this assignment, you should: Go on to Assignment 1: Continue the Mission E-mail M. Dereshiwsky
at statcatmd@aol.com
Copyright 1998
Northern Arizona University |
 This would indeed be "the gold standard" of assessing reliability!