


 |
 |
 |
 |
  |
|
BA501 : The
Class : POM :
Queuing
: Intro and Examples
Queuing Theory-
Lesson
1: Introduction and Examples
Queuing theory is concerned with the analysis and characteristics of waiting lines. Waiting lines are a common situation, such as cars waiting in line to pay a toll, a customer waiting at the check out stand, or vacationers waiting in line at an amusement park.
§ Waiting Line System Elements § Arrival Rate §
§ Queue Disciplines § Service Time Distribution §
§ Single Server (Channel) § Example – Single Server §
§ Multiple Server (Channel) § Example – Multiple Server §
A queueing system is comprised of the following elements:
· Calling population – The calling population can either be infinite or finite and represents the pool of potential customers to enter the queuing system.
· Arrival rate – This defines the rate at which customers arrive into the system.
· Queue – The queue is the actual waiting line that forms in front of the server.
· Server – The server represents the process that services the customer. When the server has completed servicing the customer, the customer leaves the system.
Customers can arrive into the queuing system either with a known arrival rate or can arrive randomly. Arrivals are considered random when they are independent of one another and their occurrence cannot be predicted exactly. Often, the process of customers arriving into the queuing system can be accurately modeled by using the Poisson distribution. For any given arrival time, a discrete Poisson distribution can be established by using the formula:
![]()
.gif) for x = 0,1,2,3,4,…
for x = 0,1,2,3,4,…
where,
P(x) = probability of x arrivals
x = number of arrivals per unit of time
l = average arrival rate
The order in which customers are served is what defines the queue discipline. For example, if the first customer before the server is always served, this would define a first in first out (FIFO) discipline. If the last customer in line is always served first, this would be considered a last in first out (LIFO) discipline. There are many other queue disciplines that could be established depending on the operation and the goals of the system.
The exact probability distribution of the service time can vary and is dependent upon the specific service process. For our purposes, the negative exponential probability distribution will be used.
The simplest queuing system is the single server model. In this configuration, a single server services a single line. The following assumptions exist:
· The queue discipline is FIFO.
· Arrivals are independent of preceding arrivals, but the average number of arrivals (arrival rate) does not change over time
· Arrivals are described by a Poisson probability distribution and come from an infinite population.
· Service times vary from one customer to the next and are independent of one another, but their average rate is known.
· Service times occur according to the negative exponential probability distribution.
· The service rate is faster than the arrival rate.
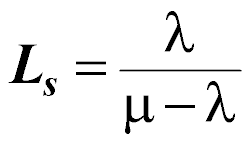
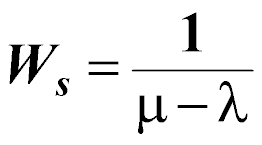
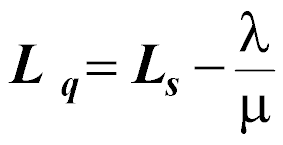
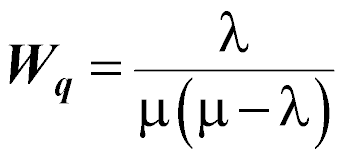
With the above assumptions in place, a queuing system’s performance can be easily calculated. In order to accomplish this, the mean number of arrivals per time period (l), and the mean number of customers served per time period (m) must be available. The performance measures follow:
The average number of customers in the entire system (this includes the number of customers in line and the number of customers being served):
The average time a customer spends in the entire system (this is the time from when a customer first joins the line/queue until the time the customer has been served and leaves the system):
The average number of customers in the queue:
The average time a customer spends waiting in the queue:
The utilization of the server:
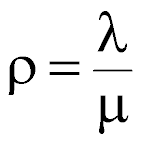
The probability that the server is idle (zero customers in the entire system):

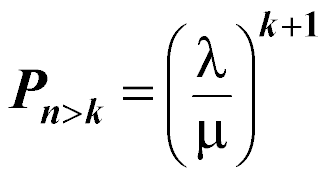
Probability of more than k customers in the entire system, where n is the number of units in the system:
Example – Single Server
A crew of mechanics at the Highway Department garage repair vehicles which break down at an average of l = 5 vehicles per day ( approximately Poisson in nature). The mechanic crew can service an average of m = 10 vehicles per day with a repair time distribution which approximates a negative exponential distribution. What are the pertinent queuing performance measures of the Highway Department garage?
The average number of vehicles in the system is:
 vehicle
The average number of vehicles in the queue is:
 vehicles
The average time that a vehicle will spend in the entire system is:
 days
days
The average time that a vehicle will spend in line is:
 days
days
The utilization of the garage is:
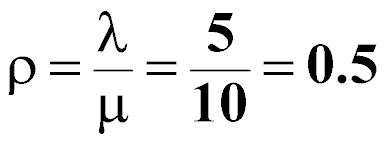
The probability that the garage is idle (or empty) is:
![]()
The multiple server model is an extension of the single server that allows for more than one server in the system. The assumptions are the same as for the single server model:
· The queue discipline is FIFO.
· Arrivals are independent of preceding arrivals, but the average number of arrivals (arrival rate) does not change over time
· Arrivals are described by a Poisson probability distribution and come from an infinite population.
· Service times vary from one customer to the next and are independent of one another, but their average rate is known.
· Service times occur according to the negative exponential probability distribution.
· The service rate is faster than the arrival rate.
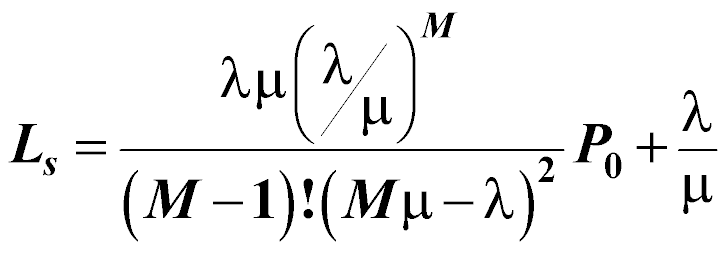
Just as with the single server model, the mean number of arrivals per time period is (l), and the mean number of customers served per time period is (m). Additionally, the number of servers available is (M). The performance measures for the multiple server model follow:
 for Mm > l


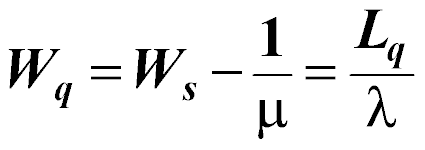
Example – Multiple Server
Robert’s Barbershop is a popular haircutting and styling salon near the campus of the University of New Haven. Four barbers work full-time and spend an average of 15 minutes on each customer (4 per hour). Customers arrive all day long at an average rate of 12 per hour. Arrivals tend to follow the Poisson distribution, and service times are exponentially distributed.
What is the probability that the shop is empty?

 0.037
0.037
What is the average number of customers in the barber shop?

What is the average time spend in the shop by a customer?
 hours
hours
What is the average time that a customer waits to be called to the barber chair?
 hours
hours
What is the average number waiting to be served?
 customers
Go on to Queuing
Theory: Home Work
or
Go back to Queuing
Theory: Activities and Assignments
Please reference "BA501 (your last name) Assignment name and number" in the subject line of either below.
E-mail Dr. Rakesh Pangasa at
BA501@mail.cba.nau.edu
or call (928) 344-7588. Use WebMail for
attachments.

Copyright © 2002
Northern Arizona University
ALL RIGHTS RESERVED