


 |
 |
 |
 |
  |
|
Excel- commands used in this topic (Excel in Office 97 and Office 2000)

§ Summary Statistics § Z Test of Hypotheses Spreadsheet §
§ Z Two-Tailed § Z One-Tail Left § Z One-Tail Right §
§ t Hypothesis Test Spreadsheet § t Two-Tailed § t One-Tail Left §
§ t One-Tail Right § Equation Summary §
1. Obtaining "summary statistics" output from Tools-Data Analysis-Descriptive Statistics necessary to do other operations. If Data Analysis does not show up, then click on Tools-Addins and select the top two options of Analysis Pack and Analysis Pack VBA.


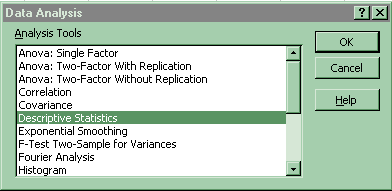
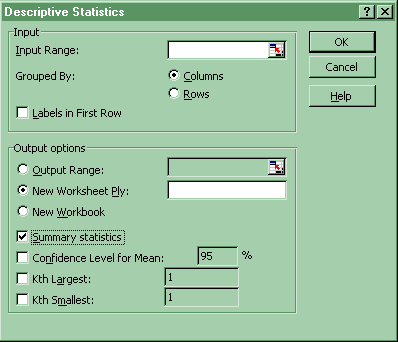
2. Z Test of Hypotheses Spreadsheet- you may use these examples to do hypothesis tests in Excel or you may load the Excel add-in which comes with the Kvanli text book. The add-in makes the process much easier.
Here is a reference spreadsheet showing the location of all important cells used in the hypothesis examples found below:
Data: 240, 250, 230, 245, 235, 241, 239, 242, 238, 243, 237, 244, 236, 246, 234, 248, 232, 249, 231, 250, 230, 230, 250, 210, 270, 211, 269, 200, 280, 199, 281, 195, 285, 190, 290, 240
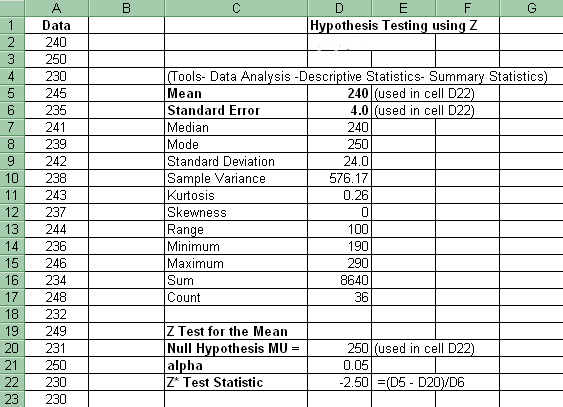
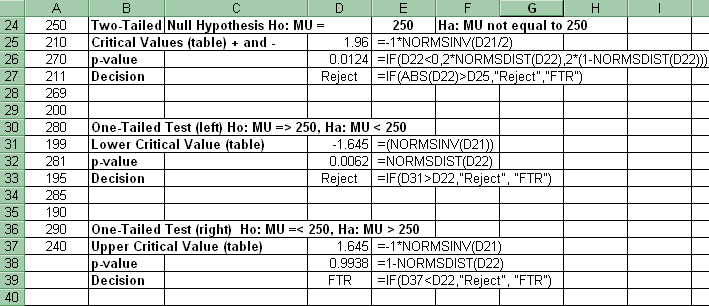
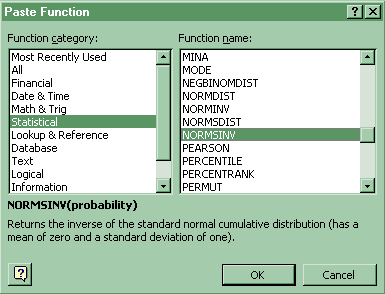
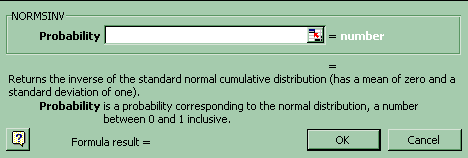
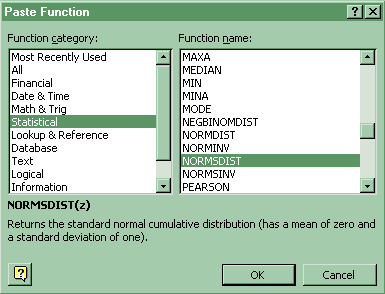
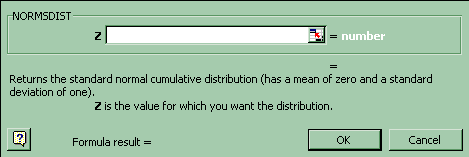
These sheets utilize the NORMSINV and NORMSDIST dialog boxes:
Click Paste Function-Statistical-NORMSINV
Click Paste Function-Statistical-NORMSDIST
A. Z Two-Tailed Hypothesis- you may use these examples to do hypothesis tests in Excel or you may load the Excel add-in which comes with the Kvanli text book. The add-in makes the process much easier.
(1) The critical values (table) in cell D25 (above) for the two-tailed Z hypothesis test has the following formula: =-1*NORMSINV(D21/2). D21 is alpha.
(2) The p-value for the two-tailed Z hypothesis test utilizing Z* has the following formula in cell D26 (above): =IF(D22<0,2*NORMSDIST(D22),2*(1-NORMSDIST(D22))). D22 is Z*.
(3) The decision utilizing the comparison of Z* to the table Z found in cell D27 (one could also compare the p-value to alpha): =IF(ABS(D22)>D25,"Reject","FTR"). D22is Z*. D25 is the table Z.
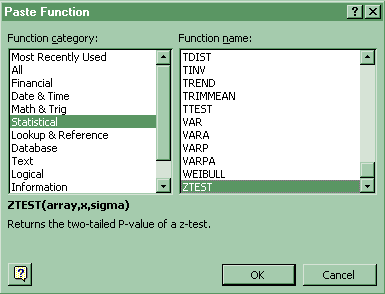
(4) You can also use an Excel built in two-tail Z test. Use Paste Function-Statistical-Ztest. This command yields the p-value for a two-tailed hypothesis test using Z.
B. Z One-Tail Left Hypothesis Test- you may use these examples to do hypothesis tests in Excel or you may load the Excel add-in which comes with the Kvanli text book. The add-in makes the process much easier.
(1) The critical value (table) for the one-tail left Z hypothesis test has the following formula in cell D31 (above): =(NORMSINV(D21)). D21 is alpha.
(2) The p-value in cell D32 (above) for the one-tail left Z hypothesis test utilizing Z* has the following formula: =NORMSDIST(D22). D22 is Z*.
(3) The decision found in cell D34 utilizing the comparison of Z* to the table Z (one could also compare the p-value to alpha): =IF(D22>D31,"Reject","FTR"). D22 is Z*. D31 is the table Z.
C. Z One-Tail Right Hypothesis Test- you may use these examples to do hypothesis tests in Excel or you may load the Excel add-in which comes with the Kvanli text book. The add-in makes the process much easier.
(1) The critical value (table) for the one-tail right Z hypothesis test has the following formula in cell D37 (above): =-1*NORMSINV(D21). D21 is alpha.
(2) The p-value for the one-tail right Z hypothesis test utilizing Z* has the following formula in cell D38 (above): =1-NORMSDIST(D22). D22 is Z*.
(3) The decision found in cell D39 (above) utilizing the comparison of Z* to the table Z (one could also compare the p-value to alpha): =IF(D37<D22,"Reject","FTR"). D37 is the table Z. D22 is Z*.
3. t Hypothesis Test Spreadsheet- you may use these examples to do hypothesis tests in Excel or you may load the Excel add-in which comes with the Kvanli text book. The add-in makes the process much easier.
See #1 above to find the steps to obtain Summary Statistics.
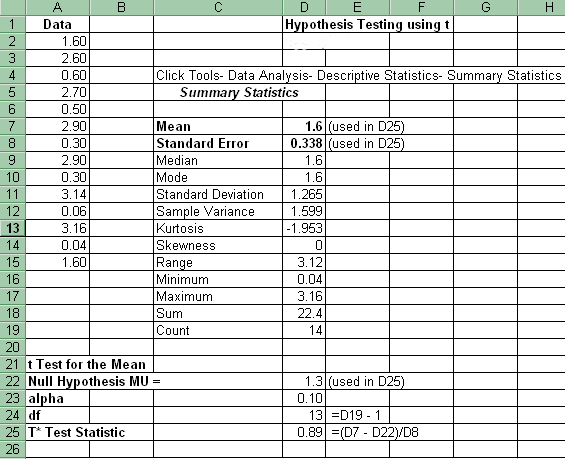
Here is a reference spreadsheet showing the location of all important cells used in the hypothesis examples found below:
Data: 1.6, 2.6, 0.6, 2.7, 0.5, 2.9, 0.3, 2.9, 0.3, 3.14, 0.06, 3.16, 0.04, 1.6
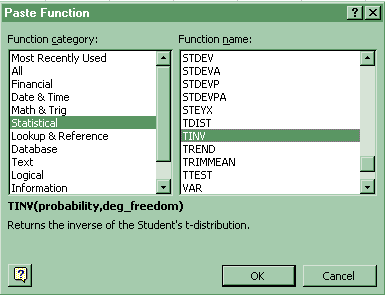
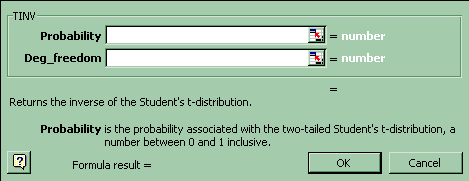
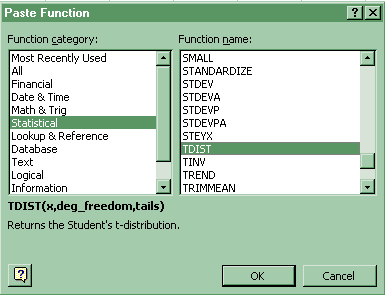
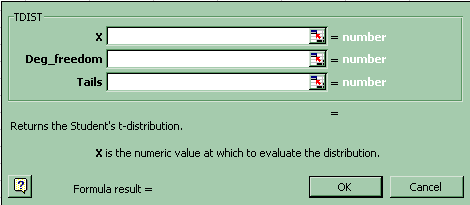
These sheet utilize the TINV and TDIST dialog boxes:
Click Paste Function-Statistical-TINV
Click Paste Function-Statistical-TDIST
A. t Two-Tailed Hypothesis- you may use these examples to do hypothesis tests in Excel or you may load the Excel add-in which comes with the Kvanli text book. The add-in makes the process much easier.
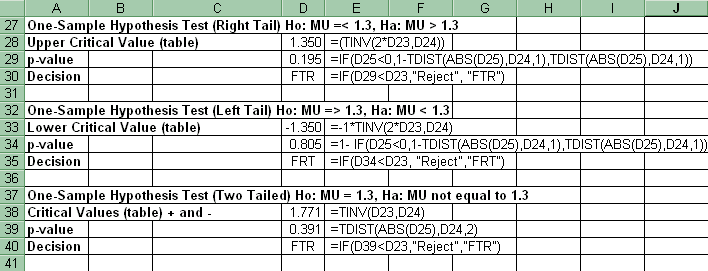
(1) The critical value (table) in cell D38 above for the two-tail t hypothesis test has the following formula: =(TINV(2*D23,D24). D23 is alpha. D24 is degrees of freedom.
(2) The p-value found in cell D39 above for the two-tailed t hypothesis test has the following formula: =TDIST(ABS(D25),D24,2). D25 is t*. D24 is degrees of freedom.
(3) The decision found in cell D40 utilizing the comparison of alpha to the p-value (one could also compare the t* to table t): =IF(D39<D23,"Reject","FTR"). D39 is the p-value. D23 is alpha.
B. t One-Tail Left Hypothesis Test- you may use these examples to do hypothesis tests in Excel or you may load the Excel add-in which comes with the Kvanli text book. The add-in makes the process much easier.
(1) The critical value (table) in cell D33 (above) for the one-tail left t hypothesis test has the following formula: =-1*TINV(2*D23,D24). D23 is alpha. D24 is degrees of freedom.
(2) The p-value found in cell D34 above for the one-tail left t hypothesis test has the following formula
=1-IF(D25<0,1-TDIST(ABS(D25),D24,1),TDIST(ABS(D25),D24,1). D25 is t*. D24 is degrees of freedom.(3) The decision found in cell D35 utilizing the comparison of alpha to the p-value (one could also compare the t* to table t: =IF(D34<D23,"Reject","FTR"). . D34 is the p-value. D23 is alpha.
C. t One-Tail Right Hypothesis Test- you may use these examples to do hypothesis tests in Excel or you may load the Excel add-in which comes with the Kvanli text book. The add-in makes the process much easier.
(1) The critical value (table) in cell D28 (above) for the one-tail right t hypothesis test has the following formula: =(TINV(2*D23,D24)). D23 is alpha. D24 is degrees of freedom.
(2) The p-value found in cell D29 above for the one-tail right t hypothesis test has the following:
=IF(D25<0,1-TDIST(ABS(D25),D24,1),TDIST(ABS(D25),D24,1) is t*. D25 is t*. D24 is degrees of freedom.(3) The decision found in cell D30 utilizing the comparison of alpha to the p-value (one could also compare the t* to table t): =IF(D29<D23,"Reject","FTR"). D29 is the p-value. D23 is alpha.
Equation Summary
§ Z*and t* § Large-Sample Two-Tailed Tests using Z §
§ Large-Sample One-Tail (left) Tests using Z §
§ Large-Sample One-Tail (right) Tests using Z §
§ Small-Sample Two-Tailed Tests using t §
§ Small Sample One-Tail (left) Tests using t §
§ Small-Sample One-Tail (right) Tests using t §
§ Procedure for Finding the p-value § Finding p-value using t §
§ Using p-value and alpha § no alpha § Other Hypothesis Tests §
1. Z* = [xbar - mo ] / [s /Ö n]
t* = [xbar - mo] / [s /Ö n]
2. Large-Sample Two-Tailed Tests using Z on the Population Mean, µ
Ho: m = mo
Ha: m ¹ mo
Reject Ho if |Z*| > Z a /2
FTR (support) Ho if |Z*| £ Z a /2
3. Large-Sample One-Tail (left) Tests using Z on the Population Mean, µ
Ho: m ³ mo
Ha: m < m o
Reject H o if Z* < - Z a
FTR(Support) H o if Z* ³ - Z a
4. Large-Sample One-Tail (right) Tests using Z on the Population Mean, µ
Ho: m £ mo
Ha: m > m o
Reject H o if Z* > Za
FTR(Support) H o if Z* £ Za
5. Small-Sample Two-Tailed Tests using t on the Population Mean, µ
Ho: m = mo
Ha: m ¹ mo
Reject Ho if |t*| > t a /2, df
FTR (support) Ho if |t*| £ t a /2,df
6. Small Sample One-Tail (left) Tests using t on the Population Mean, µ
Ho: m ³ mo
Ha: m < m o
Reject H o if t* < - t a ,df
FTR(Support) H o if t* ³ - t a ,df
7. Small-Sample One-Tail (right) Tests using t on the Population Mean, µ
Ho: m £ mo
Ha: m > m o
Reject H o if t* > ta ,df
FTR(Support) H o if t* £ ta ,df
8. Procedure for Finding the p-value:
(b) For Ha: m > mo, p-value = area to right of Z* or t*
(c) For Ha: m < mo, p-value = area to left of Z* or t*
9. Finding p-value using t
(a) go to t table
(b) find df row in problem: df = n - 1
(c) locate the value of t* on that row
(d) Note: probabilities are given by the subscript in t a at top of columns
10. Using p-value and alpha
Reject H o if p-value < a
FTR ( support ) H o if p-value ³ a
11. When no a:
Reject Ho if p-value < 0.01
FTR ( support ) Ho if p-value > 0.10
Test inconclusive if: 0.01 £ p-value £ 0.10
Other Hypothesis Tests not used at this site:
§ Two-Tailed Tests on the Population Means, m1 and m2 using Z §
§ One-Tail (left) Tests on the Population Means, m1 and m2 using Z §
§ One-Tail (right) Tests on the Population Means, m1 and m2 using Z §
§ Two-Tailed Tests on the Population Proportion, p, using Z §
§ One-Tail (left) Tests on the Population Proportion, p, using Z §
§ One-Tail (right) Tests on the Population Proportion, p, using Z §
§ Two-Tailed Tests on the Population Proportions, p 1 and p2, using Z §
§ One-Tail (left) Tests on the Population Proportions, p 1 and p2, using Z §
1. Large Independent Samples Hypothesis testing using Z for Two Means
A. Two-Tailed Tests on the Population Means, m1 and m2 using Z
Ho: m 1 = m2
Ha: m1 ¹ m2
Reject Ho if |Z*| > Z a /2
FTR (support) Ho if |Z*| £ Z a /2
Where,
Z* = [(Xbar1 - Xbar2) - (m 1 - m2 )]/ Ö [(s21/n1 + s 22/n2)]
Which is approximately equal to:
Z* = [(Xbar1 - Xbar2) - (m 1 - m2 )]/ Ö [(s21/n1 + s 22/n2)]
For n1 > 30 and n2 > 30
B. One-Tail (left) Tests on the Population Means, µ1 and µ2 using Z
Ho: m1 ³ m2
Ha: m1 < m2
Reject H o if Z* < - Z a
FTR(Support) H o if Z* ³ - Z a
C. One-Tail (right) Tests on the Population Means, µ1 and µ2 using Z
Ho: m1 £ m2
Ha: m1 > m2
Reject H o if Z* > Za
FTR(Support) H o if Z* £ Za
2. Large Sample Hypothesis testing for a Population Proportion
A. Two-Tailed Tests on the Population Proportion, p, using Z
Ho: p = p0
Ha: p ¹ p0
Reject Ho if |Z*| > Z a /2
FTR (support) Ho if |Z*| £ Z a /2
Where,
Z* = [(phat) - p 0]/ Ö {[p 0(1 - p0)]/n}
And,
np 0 > 5 and n(1 - p 0) > 5
phat = proportion of sample having a specific attribute x
= x/n
B. One-Tail (left) Tests on the Population Proportion, p, using Z
Ho: p ³ p 0
Ha: p < p 0
Reject H o if Z* < - Z a
FTR(Support) H o if Z* ³ - Z a
C. One-Tail (right) Tests on the Population Proportion, p, using Z
Ho: p £ p 0
Ha: p > p 0
Reject H o if Z* > Za
FTR(Support) H o if Z* £ Za
3. Large Sample Hypothesis testing for a Population Proportions, p1 and p 2
A. Two-Tailed Tests on the Population Proportions, p 1 and p2, using Z
Ho: p 1 = p 2
Ha: p 1 ¹ p 2
Reject Ho if |Z*| > Z a /2
FTR (support) Ho if |Z*| £ Z a /2
Where,
Z* = [(p1hat - p2hat] /
Ö {[p1hat (1 - p1hat)/(n1 - 1] + [p2hat (1 - p2hat)/(n2 - 1]}
and, p1hat = x1/n1 p2hat = x2/n2
Or a better estimate is given by,
Ö {[pbar (1 - pbar)/(n1] + [pbar (1 - pbar)/(n2}
where,
pbar = (x1 + x2)/(n1 + n2)
p1hat = x1/n1 p2hat = x2/n2
n1p1hat > 5 and n1(1 - p1hat ) > 5
n2p2hat > 5 and n2(1 - p2hat ) > 5
B. One-Tail (left) Tests on the Population Proportions, p 1 and p2, using Z
p1 and p2
Ho: p1 ³ p2
Ha: p1 < p2
Reject H o if Z* < - Z a
FTR(Support) H o if Z* ³ - Z a
C. One-Tailed (right) Tests on the Population Proportions,
p1 and p 2
Ho: p1 £ p2
Ha: p1> p2
Reject H o if Z* > Za
FTR(Support) H o if Z* £ Za
Go on to Home
Work
or
Go back to Hypothesis
Testing: Activities and Assignments
Please reference "BA501 (your last name) Assignment name and number" in the subject line of either below.
E-mail Dr. James V. Pinto at
BA501@mail.cba.nau.edu
or call (928) 523-7356. Use WebMail for attachments.

Copyright 2002 Northern
Arizona University
ALL RIGHTS RESERVED