Predator-Prey Interaction
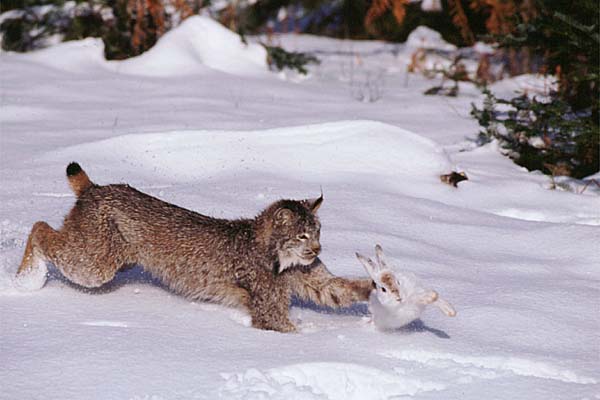
Lynx and snowshoe hare. © Tom and Pat Leeson
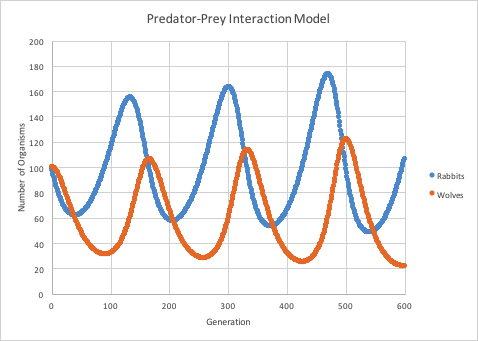
It should come as no surprise that predators influence the numbers of their prey. What may require a bit more reflection is that prey, in turn, affect the number of predators because, when prey become scarce, predators may die of starvation or fail to reproduce. This can lead to cyclical patterns of predator and prey abundance, where prey increase in number and then, with abundant food, predator number increases until the predators begin to suppress prey numbers and then decrease as well. As long as predator and prey numbers don't drop to zero, this cycle can repeat indefinitely. Interestingly though, there are situations where predators are absent, such as on islands or in other isolated areas where they either never became introduced or where they have died out, and yet prey continue to oscillate in number. What causes prey number to cycle in the absence of predators? Generally the answer is that without predators to suppress their number, prey outstrip available food resources, nesting sites, or some other limited resource and thus begin to suppress their further growth through competition. Watch these short video lectures for a very nice overview of predator-prey interactions.
Part 1: How to eat another organism
Part 2: How to avoid being eaten
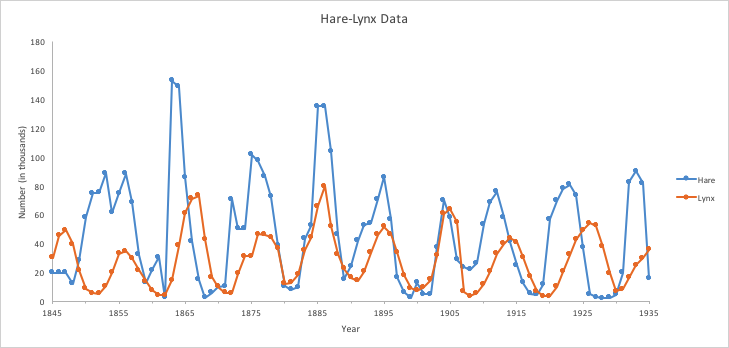
One of the classic studies of predator-prey interactions is the 90-year data set of snowshoe hare and lynx pelts ![]() purchased by the Hudson's Bay Company of Canada. While this is an indirect measure of predation, the assumption is that there is a direct relationship between the number of pelts collected and the numer of hare and lynx in the wild. As you can see, there does appear to be cycling over time in both hare and lynx number, but it's not as clean as in the simple mathematical models. Life rarely is!
purchased by the Hudson's Bay Company of Canada. While this is an indirect measure of predation, the assumption is that there is a direct relationship between the number of pelts collected and the numer of hare and lynx in the wild. As you can see, there does appear to be cycling over time in both hare and lynx number, but it's not as clean as in the simple mathematical models. Life rarely is!