 |
A Fine Mess!!!
Highlights and Differences in Qualitative Research
As I welcome you to Qualitative Research Design and Analysis Procedures,
dear cyberspace friends and partners ... that, frankly, is the
best way I can think of to sum up qualitative research!!!
In this intro/welcome module, we'll take a look at the nature and
purpose of qualitative research and specifically, how it differs
from quantitative research.
The key word, there, too is "differs from!" As we'll talk
about when we compare and contrast the differences of quantitative vs.
qualitative approaches -- we'll struggle with the fact that in lots of
people's minds, this really meant "better than/worse than."
In other words, there can be a very subtle (and well-intended, I'm
sure!) bias that we carry around: "Quantitative procedures are good/better
than qualitative procedures." Much of this comes from the way we've
been taught and, in particular, what we've been taught about quantitative
research procedures. So it isn't our (or, really, anyone else's) "fault,"
so much as a need to readjust our thinking and be aware of differences!
There are times when quantitative approaches will be superior to
qualitative; and vice versa. Actually, there will probably be
even more times when it makes sense to "have the best of both worlds"
and use a combination of some quantitative and some qualitative approaches
in order to more credibly address our research questions! (This is
called multimethod research design and procedures - and we'll revisit
this issue too!)
Open this link to read about the nature of the Qualitative-Quantitative
Debate in research.
The Qualitative
Debate
So ... let's look at some of the key features of the preceding (besides
your now having confirmation of the fact that Mary D. is hopelessly passionate
about statistics -- but you already knew that!!) and begin to take ourselves
into the realm of qualitative research:
* "Rich, thick description." This is a classic line from
Norman K. Denzin -- one of the founding fathers of qualitative research!
My story was filled to the brim with detail and context: as contrasted
to, say, a survey where you just "state the facts" -- "check off
your highest educational level completed." Well, Mary D. would check
"Ph.D." and be done with it! And I certainly started "my story" that
way to you, didn't I? On page two, in my opening sentence, I rather
factually tossed off my name and doctorate - which one, where I got
it, and in what area. Oh, but then, the rich detail you got on why
-- ! And please key in on this phrase: understanding why.
It lies at the very purpose of "going qualitative"!
* Feelings, attitudes and emotions. Did you notice how
I gave you (in abundance!) information on all three of these? I told
you how and why I felt afraid, insecure, hesitant, proud, more self-confident,
and a range of other emotions. These are very important "background
variables" in qualitative that we might need to look at, in order
to understand our initial "target" variable of interest: be it academic
achievement, parenting skills, or something similar.
* Takes the reader/observer right into the situation.
Couldn't you just picture yourself in that classroom with me? and see,
in your mind's eye, every move, hear every word, and feel every emotion
as the professor called on me and I answered? This is an important property
of "good, usable, rich, revealing" qualitative data: to provide enough
contextual detail so that we are right in that situation and can in
essence relive or experience it as our subjects initially did. This
should, in fact, include as much specific detail as possible: even things
like the arrangement of the classroom, how the students and professor
were arranged in proximity to one another, what was said, what was felt
-- even things that at first glance may even seem 'irrelevant' or 'trivial'
to those of us soooo well-schooled in "just-the-facts-quantitative-models!"
Maybe things like the weather, what you could glimpse out the window,
an unexpected classroom visitor and how everyone reacted to the interruption!
These are all part and parcel of "walking the walk" as our subjects
initially did!
When you think about it, too, dear Intro to Research and Research Design
partners, past and present: this enhanced ability to "see it and
interpret it exactly as the subjects did" is really a validity
issue, isn't it?! In grappling with the validity of our research
-- as we all must when we undertake any research study
-- be it quantitative, qualitative, or both -- we must eventually amass
evidence that our findings, results and conclusions are credible --
we haven't injected any biases, preconceived notions, etc., but rather,
have "read into the data what the subjects who gave it to us intended
that we read into 'their' data." Did I, as the researcher, see it as
they saw it? Is my analysis and interpretation credible? As we continue
to struggle with this important property of all research, validity,
we'll see that in some cases, qualitative, rather than being "biased"
for being "not quite as precise" as quantitative/numbers, actually holds
an advantage in terms of its credibility or validity in a given situation!
And such rich, thick contextual description gives us an edge in "seeing
the world through our subjects' eyes" and therefore "extracting the
'right' meaning and intent from 'their' data!"
Open this link for a discussion by Bill Trochim at Cornell about the
role of validity in qualitative research.
Qualitative
Validity
� Finally -- you may have been a bit puzzled at the title of this chapter!
-- Qualitative data can be at times very 'messy!' My story
was lengthy! And probably took longer for you to read, process, think
about, etc., than if you were sitting at a computer terminal inputting
checked-off numeric survey responses into a master database. Another
way of looking at this is: people are people! They will ramble in interviews.
They will get off-track and/or misinterpret what you are trying to ask
them. They will interject their own thoughts and comments as they see
fit. All of this can combine to make qualitative data rather "messy"
and unmanageable! It is not uncommon to come out of a one-hour group
interview session with 15+ pages of word processed transcribed notes
of all the interview comments! What an overwhelming feeling - to bring
it all back, dump it out on your desk, and sigh to yourself, "My goodness!
Now, how in the world will I ever reduce all of this down to 'neat,'
'clear,' 'well-organized' answers to my research questions?!" (And suddenly
those boxes of returned quantitative surveys that your dissertation
colleagues are mechanically inputting into that computer database look
-- well, mighty tempting as an alternative .. !) Ah, but where some
see comfort in 'fences,' others see freedom and opportunity! And we
will, indeed, learn two general ways to bring order and summary to such
voluminous, overwhelming, at times illogical, and overall downright
messy qualitative data! It is a golden opportunity for those of us who
are creatively inclined (and I don't know a whit about creativity theory,
but from what I've been told, most of us have enormous latent, untapped
potential in that area) to form our own "packaging" of these qualitative
data, make our own 'rules,' if you will, on how to distill it down to
manageable proportions, in order to "best" answer our research questions!!
�
With the preceding example, and these highlights, in mind, let's now proceed
to take a look at some key difference in emphasis or focus between
quantitative and qualitative research.
Please open the link below and look at some of the distinguishing characteristics
of qualitative vs. quantitative research.
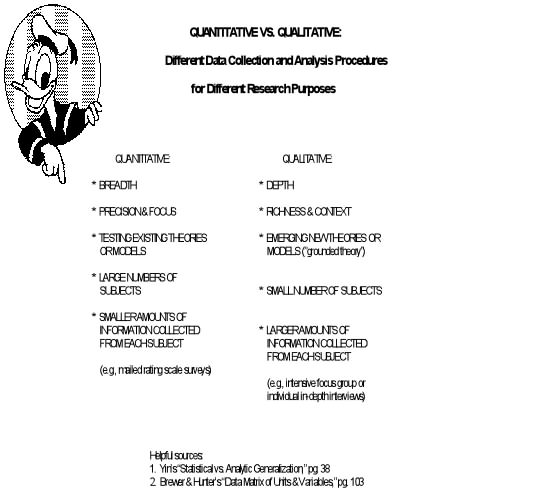
Donald
What can I say?! With the typical "illogic" that can go hand in hand
with qualitative research, I happened to be playing with resizing and
pasting graphics into ClarisWorks. And I'd just downloaded a neat set
of Disney clip art from the America Online software libraries! So -- Donald
will kind of be our guide and mascot as he points out the following differences!
- Breadth (quantitative) vs. Depth (qualitative).
This one might best be depicted via Eliot Eisner's excellent
metaphor of "the fox vs. the hedgehog!" (please see the diagram
below):
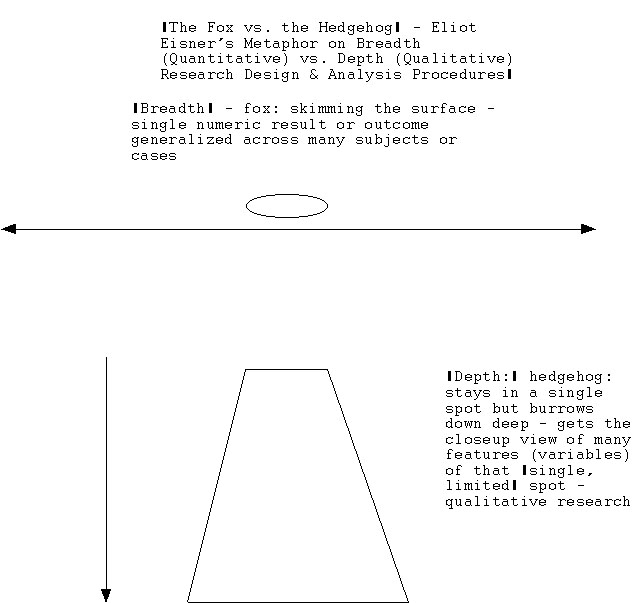
- Quantitative analysis is like the fox! Its paws quickly
skim the surface as it travels fast and covers a lot of ground!
For Intro to Statistics fans, this would be like taking a single
("limited") quantitative outcome such as "average ITBS math
scores" and projecting the sample value across 100's, or even
1,000's of cases (say, 4th grade students across the country)
with a given p-value of "confidence!"
Covers a lot of ground (like our ability to generalize
"with 95% confidence," say!) but you 'trade off depth!'
That is: it's a single, perhaps rather limited numerical outcome!
- Qualitative analysis is like the hedgehog! It "stays
in a single spot" - e.g., a limited circle of ground. So maybe,
as the fox is dashing past the hedgehog, the fox feels superior:
see how far I can run?!"
But -- replies the hedgehog -- I can burrow down deep! And
oh, the rich, varied close-up view I can get of the different
plants, roots, stems, earthworms, bugs, pebbles, and other stuff
as I go down deep! In essence: I get a better and wider look
at that single spot - and you miss all that entirely as you're
running across the ground!
And -- a qualitative researcher may need, or want, to only "deeply
understand" a single "spot!" This could be a school, a clinic, a
vocational technical training program, and so forth. He/she may
have no need or desire to generalize his/her particular research
findings "with 95% confidence" to 1,000's of other schools, clinics,
vocational training programs, and so forth!
This, then, is the idea of "breadth" vs. "depth!"
i) Breadth -- ability/need to generalize or project a limited
(set of) quantitative result(s) across "large" numbers of cases
or subjects. From our statistics courses, this would be
akin to "generalizing a sample statistic with, say, 95% confidence"
to a wider, predefined target population from which that sample
was randomly drawn. Or, equivalently, it could be "bounding" that
sample statistic "with 95% confidence" so that we can be sure that
95% of samples of subjects drawn randomly from within that population
would have sample values that fall within the upper and lower bounds
of that confidence interval.
ii) Depth -- ability/need to "deeply understand" a more
limited setting or number of subjects. No desire to generalize,
necessarily, to other subjects or settings at the present time.
Thus, a greater need to "delve more deeply" into the limited setting(s),
subject(s), or program(s) -- e.g., collect lots more information
on them to enrich this desired understanding.
Back to the Donald Duck graphic ...Donald
- Precision and Focus (quantitative) vs. Richness and Context
(qualitative). This relates to the preceding breadth vs. depth
discussion that we started above.
- The relative strength of quantitative analytic procedures
is their precision and focus. Such inferential statistical
procedures as estimation and hypothesis testing (at predetermined
confidence levels, e.g., 95% certainty) allow us to attain desired
precision and focus of our target quantitative variables. For instance,
it gives the researcher considerable "generalizing power" if he
or she can do the calculations and say, "Therefore, I can be 95%
confident that for all fourth graders from which my study sample
was drawn, the average ITBS test score would be expected to be between
[Value 1] and [Value 2]." This is a strong statement! For as I've
pointed out in Intro to Statistics, such inferential or analytic
estimation procedures "can't guarantee how right you'll be" (really
no such thing as "100% confident," unless of course your "sample"
is really your entire population too!) -- but -- they do allow us
to limit or bound "how wrong you can be." In other words, if you
apply the calculations correctly, your margin of error cannot be
more than 5% for bounding your ITBS test score. That is: you can
ensure that no more than 50 out of 1,000 random samples of your
population of fourth graders (or, 1,000 X 0.05) will have actual
ITBS scores that are either a) below Value X (your lower limit)
or b) above Value Y (your upper limit).
Such precision and focus of results may be EXACTLY what you
are after in terms of why you did your study! That is: you
may need such 'near certainty' for superintendents, school boards,
funding agencies, budget departments, and so forth. This would
be an ideal reason to plan to collect and inferentially analyze
(at least some) quantitative data to answer the research questions
of your study!
- The relative strength of qualitative procedures is their
richness and context. As pointed out in the "fox vs. hedgehog"
comparison, you may not need or want to construct
numeric (95%) confidence intervals and project your findings to
large numbers of subjects, schools, clinics, etc. Your focus may
be a single setting, school, clinic, vocational technological training
program, or even a single subject!
But then, in order to "really get into" this single (or a "small
number of") setting(s), subject(s), etc., you've got to get "closer
up" (like our burrowing friend the hedgehog) and get lots
more information about it/them! That's another way of saying,
I guess, that your list of target or outcome variables will be
greatly expanded! Anything and everything could be (and should
be) fair game: the subject's own demographics, feelings, attitudes;
historical records and documents; your own (and/or colleagues')
field notes of your perceptions of behaviors, attitudes, and so
forth; perhaps interviews held with "significant others" in that
person's life who are in a position to 'fill in some gaps' regarding
his/her attitudes, emotions, feelings and behaviors. The list
could be virtually endless!
- Testing existing theories or models (quantitative) vs. Emerging
new theories or models (qualitative).
In a nutshell, I guess we can define this one as follows. The more
we already "know" (through prior research work, scientific laws
of nature, and so forth) about "what causes what," the easier it
will generally be to quantify these relationships! Existing theories
that have been extensively "road-tested" or validated are more amenable
to such quantification. Another way of saying this relates back
to Point 2 (pg. 10) - namely, it is easier to be "more precise"
in our measurement ("go quantitative"), the more we "already know"
about some phenomenon (theory). For example, there are a number
of well-validated, established theories on human motivation, satisfaction,
stages of learning, and the like. This is what we mean when we say
"extent of understanding of a given phenomenon." And testing and
refinement of such theoretically specified relationships seem to
also go hand in hand with our classic experimental design model.
The typical scenario is this: "If I change Variable X by N units
and try to control (hold constant or randomize on) all other variables,
how will Variable Y change? and by how much? will Y then 'behave'
as my model predicts? or will it be different - in which case we
might need to modify this theoretical model of X and Y?"
On the other hand, the opposite extreme -- purely exploratory research
- is not only "OK" but a natural fit for qualitative research! "I
have no idea, or only very rough ideas, as to why teachers choose
to mentor other teachers. So - rather than having a preconceived
model to 'test,' I'm going to go into a school, spend some time
observing and interviewing mentor and mentee teachers, and then
see which key salient factors 'emerge' from these observational
and interview data!"
There, too, we sometimes carry around hidden biases (especially,
hidden from ourselves!) that such "mucking-around exploratory"
research is "bad!" We say to ourselves, "Oh, that will never
do: it's way too vague! I need to have a far more
precise understanding of what I'm studying for it to be 'real'
research!"
But ... think of it this way. Where else do those 'fancy, precise'
theoretical models start? From exactly such rough stages of understanding!!!
And so it is with qualitative research! We may go in to answer
an exploratory research question: "What are the key factors that
motivate teachers to enter the teaching profession?" and either
start off with very rough, primitive models -- or even none at all!
The "no prior ideas -- let the parts of the theory, or the answers
to my research question, emerge entirely from my study results"
is what is known as "grounded theory!" This is a
critical concept in qualitative research, for it forms much
of the rationale. In order to "build from scratch," you will indeed
need to rely on lots of variables or observations, as well as the
'rich, thick' description that is the hallmark of qualitative research!
A rating scale simply won't let you get at the heart of beginning
to build a theory, or model, of how and why something happens --
especially if you have little or no prior research work to guide
you in the understanding of this phenomenon that you are trying
to study.
Open this link and scroll down to the "Grounded Theory" section
for further discussion.
Grounded
Theory
- Large(r) numbers of subjects (quantitative) vs. Small(er)
numbers of subjects (qualitative).
We've touched on this one in the preceding points as to the desired
purpose and focus of your study. You may recall learning in an intermediate
statistics course that in order to apply certain inferential or analytic
statistics, the researcher/statistician needs certain minimum sample
sizes -- to really get a "good fix" on the value of that statistic.
So, generally, quantitative studies imply "larger" numbers of subjects
than do qualitative. And, as indicated in Point # 2, above, the researcher
may only need or want to focus on a single (or very "limited") number
of subjects or settings for his/her particular investigation. This
is perfectly OK and would imply that qualitative data ought to be
at least a part of the "answer".
- Smaller amounts of information collected from each subject
(quantitative) vs. Larger amounts of information collected from each
subject (qualitative).
This, too, kind of "goes along with" the desired focus of our
studies, as well as Point 4, above. Now, those of you who've been
shall-we-say "imposed upon" by getting those lengthy survey questionnaires
in the mail may disagree with me when I characterize quantitative
(or quantifiable) data as "limited" in scope! True, a multi-page,
Likert-scaled survey may be time-consuming and seem like "a lot"
of information to provide! Yet, comparatively speaking, qualitative
data collection traditionally yields greater quantities of information.
Most of this is due to that "rich, thick description" that is part
and parcel of, say, individual or group interviewing. You'd be surprised
how much "paper" you'll come out with even if you're doing a couple
of one-hour in-depth interview sessions with one subject! And so,
that's why, with the richness, context, and so forth, you simply
tend to "get more volume" with qualitative data than with quantitative.
At this point, please take a moment to re-read Points # 4 and # 5 above.
I'd like to show you how researchers have sort of "put them together"
and suggested the following relationship.
Researchers who understand that "quant. vs. qual" is "different --
*not* better vs. worse" have specifically suggested that the following
are basically "equalized:"
Quantitative:
[Larger numbers of subjects (Point 4)] X [Less information from each
subject (Point 5)] =
Qualitative:
[Smaller numbers of subjects (Point 4)] X [More information from each
subject (Point 5)]
This kind of translates into a question of "fairness," "equity," and
"when is 'enough enough?!'" That is to say: we sometimes come out of
our inferential/analytic quantitative classes (even, heaven forbid,
Mary D.'s traveling Intermediate Statistics cyberspace classroom), thinking
"Unless we've got 'lots and lots' of subjects to get our data from,
our sample is 'too small' and our data might be 'biased' in some way!"
But -- researchers are now saying: well, OK, but please remember to
"balance that out! with Point 4 - namely, look at how much more you're
getting per subject with the qualitative! And so their suggestion is
that the "total amount of data collected" (the product of Point 3 and
Point 4, as illustrated by the formula above) will generally balance
out!!
P.S. Before we leave the subject of the "Donald
Duck" handout, I'd like to point out that I'll be returning to those
mysterious-looking two "end-notes" at the bottom of the page and discussing
them in future chapters! (I had them in there when I originally worked
up this Donald Duck handout for a one-shot presentation. I thought the
handout would still be very relevant to our purposes -- but we have
the "luxury" of more time to talk about qualitative and so I didn't
want to alter the handout, but rather,I suggest to you, "Stay tuned
and keep it handy!") Thanks!!!
* * *
As our last goal for this first qualitative chapter, let's now revisit
the issue of "why" being such a "good research question" to
"attack" or address via qualitative research procedures. If you'll
recall, I suggested this in our preceding discussion. In light of the
earlier discussion, I'll bet you can zero in on the answer right along
with me, too!
"Why" is a question that virtually "begs for the 'rich, thick description,'
'context and detail' that is part and parcel of qualitative procedures!"
For instance: suppose I am trying to self-assess my teaching effectiveness.
I learn that on the traditional CEE/NAU quantitative numerical rating
scale, I've gotten a 4.8 out of a possible 5.0. (with -- I quickly add!
-- "1" being "poor" and "5" being "excellent!" Whoops, I almost broke
my own Intro to Statistics Learning rule, there, of ordinal data and
how we need to know the directionality of the ratings/rankings!)
This tells me "what" but not "why!"
For instance: why did I not get a 5.0? (e.g., what could I improve
on?) And why did I get a 4.8 as opposed to, say, a "good" or 4.0? (e.g.,
what am I doing "very right" that I need to continue doing to be a 'good
teacher?!')
We have already studied a classic research 'setup' for 'why' questions
-- but ones which are rigidly structured and tightly controlled.
Namely: these would be experimental designs. But these types
of "why" questions have the 'relative advantage' of extensive prior
theory (and thus, other researchers who've paved the way before
us, and for us, to test out their theories) and the clinical laboratory
type of setting where we have the ability ("luxury?!") of "manipulating
one factor, X, while holding all other factors constant, and then observing
what happens to our target outcome, Y."
"Nice setup if you can get it!" But that is a special case
of a "well-defined" "why" question. This one, due to the extensive
prior work on the factors of "why," as well as the "luxury" of
such tight experimental control, has traditionally been addressed
with quantitative analytic procedures.
Yet -- the more interesting "why's" typically occur out
in the real world! Where such control and/or prior knowledge are often
not feasible! We must take things as they come and then attempt
to piece together the answer to the "why!" Such exploratory,
field-based "why" investigations are much more amenable to qualitative
procedures
This is the general idea...but a very big name in qualitative research
procedures, Robert K. Yin (and you'll be hearing lots more about him!)
has proposed the following general schematic for "when to go quantitative
vs. qualitative: different research questions and study purposes (from
Yin, c/o Cosmos Corporation, 1994):"
| Research Strategy |
General Form of Research Question |
Does It Require "Tight Control" over Behavioral Events? |
Does It Focus on Contemporary Events? |
| Experiment |
how, why |
yes |
yes |
| Survey |
who, what, where, how many, how much |
no |
yes |
| Archival (already existing data, vs. generated by
the researcher) analysis |
who, what, where, how many, how much |
no |
yes/no |
| History |
how, why |
no |
no |
| Case Study |
how, why |
no |
yes |
As those who've taken Intro to Research and Research Design probably
realize, the preceding list of types of studies (Column 1) is by no
means exhaustive. Different designs, and variations on these designs
(e.g., true vs. quasi-experiment for Line 1, for instance) do exist.
The preceding is more of a general framework.
In particular, the type of question (column 2), along with the
relative "control" (or, more properly, lack of it -- e.g.,
being in a totally naturalistic, field-based setting such as
visiting a school in session) determine the appropriateness or feasibility
of qualitative procedures.
Yin argues that for "tally-type questions," such as the "how
many" (men vs. women who filled out a survey), quantitative procedures
are superior. They indeed would "answer the question." The same would
be true of archival studies -- document analysis, say, to count up "how
many lawsuits during the 1960's involved cases of freedom of speech."
Such tally/how many/how much questions would require a quantitative
approach, because "the answer is a number."
On the other hand, the naturalistic "why's" and "how's" of the
field-based case study, for instance, virtually cries out for the "rich,
thick description" that an interview subject, say, could provide. A
numeric Likert-scaled type survey simply won't let us get at the heart
of such "inner motivations, feelings, emotions, rationale" for how and
why something is as it is. This, then, would imply a qualitative
approach.
- - -
... and there you have the rationale for our starting title! A "mess"
may be what we must deal with in qualitative -- as opposed to the neat,
precisely arrayed columns of numbers. At the same time, qualitative
data sure can be fine in helping us delve deeply into such messy
but intriguing real life issues as to how and why people do things!
Please click on the link to read My Story
for an example of qualitative narration and reporting that will also
be associated with one of our very first assignments!
I'm glad you're with us and willing to take this "close-up" view of
our world ... !

... and may all your "views" be rich and enlightening ... !
Once you have finished you should:
Go back to Qualitative
Research Highlights and Differences
E-mail M. Dereshiwsky at statcatmd@aol.com
Call M. Dereshiwsky at (520) 523-1892

Copyright © 1999 Northern Arizona
University
ALL RIGHTS RESERVED
|