


|
|
|
|
|
|
Introduction- Lesson 1
Regression analysis is used primarily for predictive purposes. The result of the least squares method of simple regression is an estimated equation based on a sample. Statistics generated from a sample (the intercept and slope of the regression equation) are used as estimates of parameters in the population. Hypotheses tests are used to draw conclusions about the a claimed values for the populations parameters. Confidence intervals are used to attempt to quantify the populations parameters within a range of possible values. Analysis of variance is used to determine the coefficient of determination as a measure of the strength of the regression equation.
1. Least Squares Line- Simple Linear Regression
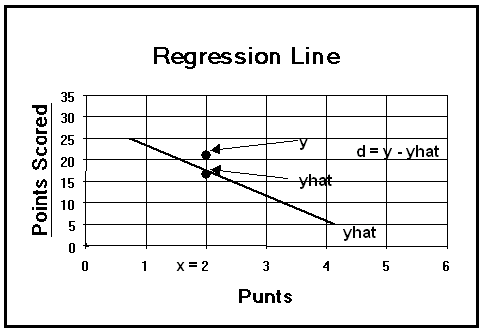
(A) Least Squares ( Regression ) Line-
(1) The "best fitting" line through the bivariate data (ordered pairs, x,y).
(2) For any x there are two associated y values:
(a) the observed value for y (in the ordered pair), and
(b) the predicted value, yhat, on the regression line.
(c) d = y - yhat
(d) S d = S (y - yhat) = 0
[1] When calculating a variance: S (x - xbar) = 0. Solved by squaring,
S (x - xbar)² ![]() (click me)
(click me)
(e) d² = S (y - yhat) ²
(3) "Best fitting" means that the sum of the squared deviations of the observed data (ys) from the associated predicted values (yhats) is minimized.
(a) d² = S (y - yhat)² ( minimum possible)
(b) d² = SSE (Sum of Squared Errors)
(c) d² = SSy - [SCPxy]² / SSx
where,
[1] SCPxy = [ S xy - (S x)( S y) / n]
[2] SSx = [S x²- (S x)² / n]
[3] SSy = [S y²- (S y)² / n]
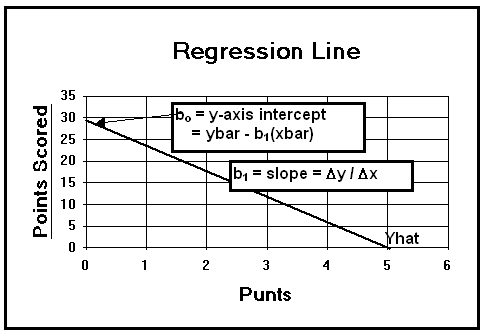
(B) Slope of the Regression Line:
(1) b1 = D
y / D x ![]() (click
me)
(click
me)
(2) b1 = [S xy - (S x)( S y) / n] / [S x²- (S x)² / n]
(3) b1 = SCPxy / SSx
where,
(a) SCPxy = S xy - (S x)(S y) / n
(b) SSx = S x²- (S x)² / n
(C) bo = y-intercept of the Regression Line:
bo = ybar - b1(xbar)
where
(1) xbar = S x / n
(2) ybar = S y / n
(D) Least Squared Regression Line Equation
(1) Yhat = bo + b1[x]
(2)
![]() The regression line can be completely defined knowing the slope and the y
axis intercept. True
False
(click one)
The regression line can be completely defined knowing the slope and the y
axis intercept. True
False
(click one)
2. The Simple Linear Regression Model
(A) Use a statistical model to represent a "true but unknown" relationship between X and Y.
(B) Y = b o + b 1[X] + e
(1) b o + b 1 are unknown parameters.
(2) e = error, the random part of model.
(3) bo (y axis intercept, statistic based on a sample) is an estimate of b o
(4) b1 (slope, statistic based on a sample) is an estimate of b 1
(C) Assumptions for the Simple Linear Regression Model-
(1) X is non-random.
(2) For each x, the random component is e (distribution of errors).
(a) The mean of each e component is zero.
(b) Each e component is normally distributed.
(c) The variance of each e component is same for each X.
(d) The errors are independent of each other. ![]() (click me)
(click me)
(D) Estimating the Error Variance, s ²e
(1) s² = s ²e(hat) = estimate of s ²e = SSE / [n- 2]
= MSE
(click me)
(a) MSE = Mean Square Error = SSE / (n - 2)
(2) SSE = S (y - yhat)²
= SSy - [SCPxy]² / SSx
where,
[a] SSy = S y² - (S y)² / n
[b] SCPxy = S xy - (S x)(S y) / n
[c] SSx = S x² - (S x)² / n
(3) s = Ö s² = Ö [s ²e(hat)] = Ö (SSE / [n - 2]) = Ö MSE
![]() The variance of the
error term should take on different values associated with different x values
in a given regression analysis. True
False
(click one)
The variance of the
error term should take on different values associated with different x values
in a given regression analysis. True
False
(click one)
3. Inference on the Slope, b 1
(A) Performing a Test of Hypothesis on the Slope of the Regression Line-
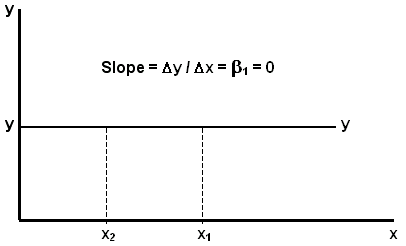
(1) If the population slope b 1 = 0, then x is not a good predictor of y.
![]() (click me)
(click me)
(2) If the population
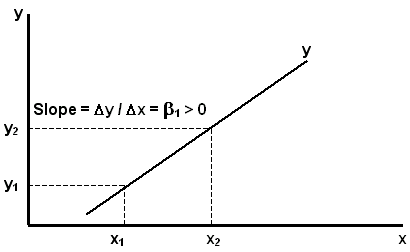
slope b 1
> 0, then x and y have a positive relationship.
![]() (click me)
(click me)
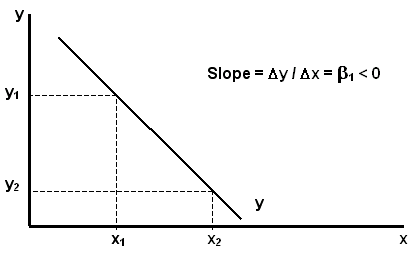
(3) If the population
slope b 1
< 0, then x and y have a negative relationship.
![]() (click me)
(click me)
(B) Two tail tests
(1) Two-tail hypothesis:
Ho: b 1= 0 ( equals zero)
Ha: b 1 ¹ 0 ( does not equal zero)
(2) Table statistic for two-tail test: (critical value)
t a
/2,(n - 2 ) ![]() (click me)
(click me)
(3) Computed statistic: (for all tests)
t* = [b1 - b 1] / Sb1
= [b1 - b 1] / [ s / Ö SSx ]
where,
(a) Sb1 = Standard Error of the Coefficient
= s / Ö SSx
![]() (click me)
(click me)
(b) s = Ö s² = Ö (SSE / [n - 2]) = Ö MSE
(c) SSE = S (y - yhat)2 = SSy - [SCPxy ] 2 / SSx
(d) SSy = S y²- (S y)² / n
(e) SCPxy = S xy - (S x)(S y) / n
(f) SSx = S x²- (S x)² / n
(4) Two Tail Hypothesis Test on the Slope of the Regression Line
Ho: b 1= 0
Ha: b 1 ¹ 0
Reject Ho if |t*| > t a / 2,(n - 2)
FTR(Support) Ho if |t*| £ t a / 2,(n - 2)
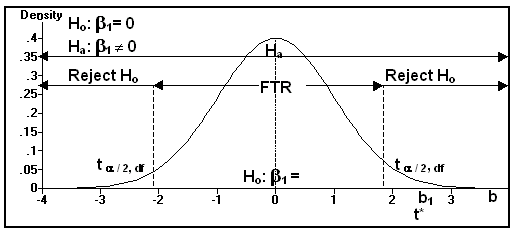
(5) The position of t* is determined by b1.
(C) One tail test right:
(1) One-tail right hypothesis:
Ho: b 1 £ 0 ( equal to or less than zero)
Ha: b 1 > 0 ( greater than zero)
(2) Table statistic for one-tail test right: (critical value)
t a, (n - 2 ) (full a and n - 2)
(3) Computed statistic: (for all tests)
t* = [b1 - b 1] / Sb1
(4) One Tail Hypothesis Test (Right) on the Slope of the Regression Line
Ho: b 1 £ 0
Ha: b 1 > 0
Reject Ho if t* > t a, (n - 2)
FTR(Support) Ho if t* £ t a, (n - 2)
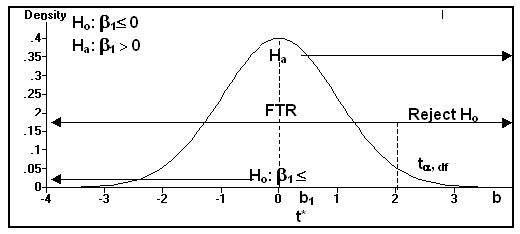
(5) The position of t* is determined by b1.
(D) One tail test left:
(1) One-tail left hypothesis:
Ho: b1 ³ 0 ( equal to or grater than zero)
Ha: b1 < 0 ( less than zero)
(2) Table statistic for one-tail test right: (critical value)
- t a, (n - 2 ) (full a and n - 2)
(3) Computed statistic: (for all tests)
t* = [b1 - b 1] / Sb1
(4) One Tail Hypothesis Test (Left) on the Slope of the Regression Line
Ho: b 1 ³ 0
Ha: b 1 < 0
Reject Ho if t* < - t a, (n - 2)
FTR(Support) Ho if t* ³ - t a, (n - 2)
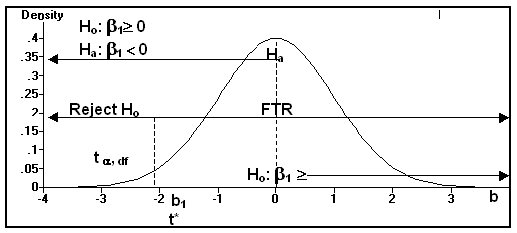
(5) The position of t* is determined by b1.
(E) Confidence Interval for b 1
(1) ± t a / 2,(n - 2) = [b1 - b 1] / Sb1 (solve for b 1)
(2) CI for b 1 = b1 ± [t a / 2,(n - 2)]Sb1
(a) b1 (sample statistic) is the point estimate of b 1 (population parameter).
(b) t a / 2, (n - 2) is the table t value which measures the number of standard errors of the coefficient.
(c) Sb1 is size of each standard error of the coefficient.
![]() The confidence interval for
b 1 uses a different standard error of the coefficient than used
an hpothesis test on b 1. True
False
(click
one)
The confidence interval for
b 1 uses a different standard error of the coefficient than used
an hpothesis test on b 1. True
False
(click
one)
4. Measuring the Strength of the Model: Coefficient of Determination
(A) Coefficient of Determination-
(1) Measures the percentage of variation in the dependent variable explained by the regression line.
(2) The variation of the observed value, y, from the average value, ybar.
(3) total variation
= explained variation + unexplained variation
= 100%
(4) SSy = SSR + SSE
(a) SSy = total variation ![]() (click me)
(click me)
(b) SSR = explained variation ![]() (click me)
(click me)
(c) SSE = unexplained variation ![]() (click me)
(click me)
(5) SSy / SSy = SSR /SSy + SSE /SSy
(a) 1 = SSR / SSy + SSE / SSy
(b) (SSR / SSy)100 = % of variation of y explained by the position of the regression line.
(c) (SSE / SSy)100 = % of variation of y unexplained by the position of the regression line.
(6) r² = 1 - SSE / SSy = SSR / SSy
(a) SSy = S( y - ybar)² = S y² - (S y)² / n
(b) SSR = S(yhat - ybar)² = (SCPxy)² / [SSx]
(c) SSE = S(y - yhat )² = SSy - [SCPxy]²/SSx
where,
[1] SCPxy = S xy - (S x)(S y) / n
[2] SSx = S x²- (S x)² / n
[3] SSy = S y² - (S y)² / n
(7) Also note: If r = [SCPxy] / (ÖSSx)(ÖSSy)
then: r2 = { [SCPxy] / (ÖSSx)(ÖSSy) }2 = [SCPxy] 2 / (SSx)( SSy)
![]() If the regression
line were flat with slope of zero, and Yhat = Ybar, which of the following would
be equal to zero? SSy
SSR
SSE
(click
one)
If the regression
line were flat with slope of zero, and Yhat = Ybar, which of the following would
be equal to zero? SSy
SSR
SSE
(click
one)
Go on to Regression
Analysis: Examples
or
Go back to Regression
Analysis: Activities and Assignments
Please reference "BA501 (your last name) Assignment name and number" in the subject line of either below.
E-mail Dr. James V. Pinto at
BA501@mail.cba.nau.edu
or call (928) 523-7356. Use WebMail for attachments.

Copyright © 2002 Northern
Arizona University
ALL RIGHTS RESERVED
