

 |
 |
 |
 |
  |
|
§ Lesson 1- Introducton §
§ Bivariate Data § Coefficient of Correlation §
§ Correlation Conceptual Formula § Correlation Computing formula §
§ Two-Tailed Hypothesis Test § One tail (Left) Hypothesis Test §
§ One tail (Right) Hypothesis Test §
(1) Bivariate data- two variables, x and y.
(B) Ordered pairs must stay together (can not mix).
![]() What is the minimum number of ordered pairs necessary to form a straight line?
One
Two
Three
(click one)
What is the minimum number of ordered pairs necessary to form a straight line?
One
Two
Three
(click one)
(2) Coefficient of Correlation, r, measures the strength of the linear relationship within a sample of n bivariate data.
(A) How well do the ordered pairs line up in a straight line?
(B) r = 0 shotgun effect
(click me)
(C) r = + 1 perfect positive correlation
(click me)
(D) r = - 1 perfect negative correlation
(E) r = +0.8 strong positive correlation
(click me)
(F) r = - 0.9 strong negative correlation
(G) r = 0.4 weak positive correlation
(H) r = - 0.35 weak negative correlation
(I) Slope can not be used to determine r.
(click me)
(J) Properties of r:
[1] range: - 1 £ r £ + 1
[a] r = - 1 indicates a perfect negative linear relationship between x and y.
[b] r = + 1 indicates a perfect positive linear relationship between x and y.
[c] r does not have units of measure attached; but,
slope does. ![]() (click me)
(click me)
[2] The larger |r| , the stronger the linear relationship between x and y.
[3] r = 0 indicates no linear relationship between x and y.
[4] The signs of r and slope are always the same.
(click me)
![]() A perfect positive correlation between x an y indicates that x causes y to occur.
True
False
(click one)
A perfect positive correlation between x an y indicates that x causes y to occur.
True
False
(click one)
(3) Correlation Conceptual formula: (do not use for hand calculations)
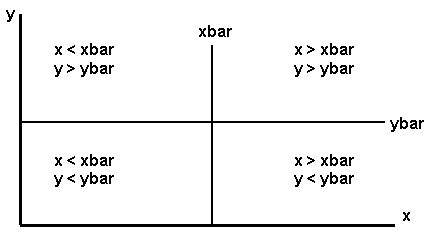
(A) r = S[x - xbar][y - ybar] / Ö [S (x - xbar)²]Ö [S (y - ybar)²]
The value of r depends on the relationship between x with xbar and y with ybar as seen in the following diagram.
(B) Diagram: ![]() (click me)
(click me)

(4) Correlation Computing formula: (use this one for hand calculations)
(A) r = [Sxy
- (Sx)(Sy)
/ n] / Ö [Sx²-
(Sx)² / n]
Ö [Sy²-
(Sy)² / n] ![]() (click me)
(click me)
(B) = SCPxy / Ö [SSx ]Ö [SSy ]
where,
[1] SCPxy = [S ( x )( y ) - (Sx )(Sy ) / n]
(Sum of Cross Products x and y)
[2] SSx = [Sx² - (Sx )² / n ]
(Sum of Squares x)
[3] SSy = [Sy² - (Sy )² / n ]
(Sum of Squares y)
(C) SSx and SSy are numerators of variances.
[1] Sx² = [Sx² - (Sx)² / n] / [n - 1] = [SSx ] / [ n - 1]
[2] Sy² = [Sy² - (Sy)² / n] / [n - 1] = [SSy ] / [ n - 1]
![]() If SSy and SSx are always positive, the sign of the correlation coefficient,
r, must be determined by the sign of SCPxy. True
False
(click
one)
If SSy and SSx are always positive, the sign of the correlation coefficient,
r, must be determined by the sign of SCPxy. True
False
(click
one)
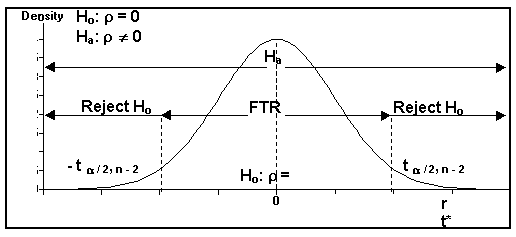
(5) Two-Tailed Hypothesis test on Population Correlation Coefficient, r (rho = roe)
![]() (click me)
(click me)
Ho: r = 0
Ha: r ¹ 0

(A) Computed value: t* = r / Ö[(1 - r²) / (n - 2)]
(B) Table statistic: t a /2,(n - 2)
(C) This example shows r and t* in the right tail; thus, reject Ho.
Two Tail Hypothesis Test on Correlation Coefficient, r
Ho: r = 0
Ha: r ¹ 0
Reject Ho if |t*| > t a / 2,(n - 2)
FTR(Support) Ho if |t*| £ t a / 2,(n - 2)
![]() You must have a standard error of the correlation coefficent in order to calculate
t*. True
False
(click
one)
You must have a standard error of the correlation coefficent in order to calculate
t*. True
False
(click
one)
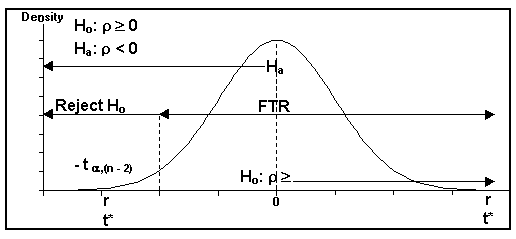
(6) One tail (Left) Hypothesis test on Population Correlation Coefficient on r
(A) One-tail left hypothesis:
Ho: r ³ 0
Ha: r < 0

(B) Table statistic: t a ,(n - 2)
(C) Computed value: t* = r / Ö[(1 - r²) / (n - 2)]
(D) This example shows r and t* in the left tail; thus, reject Ho.
One Tail Hypothesis Test (Left) on Population Correlation Coefficient, r
Ho: r ³ 0
Ha: r < 0
Reject Ho if t* < - t a ,(n - 2)
FTR(Support) Ho if t* ³ - t a ,(n - 2)
![]() Which end of the distribution would
r be located to show extreme statistical evidence against Ho:
r ³
0
? Left
Right
(click one)
Which end of the distribution would
r be located to show extreme statistical evidence against Ho:
r ³
0
? Left
Right
(click one)
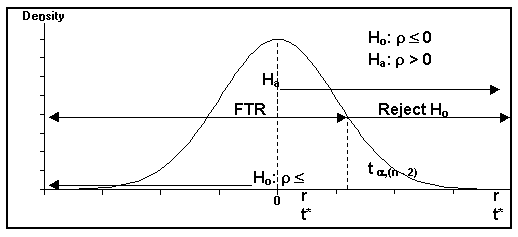
(7) One tail (Right) Hypothesis Test on Population Correlation Coefficient, r
(A) One-tail right hypothesis:
Ho: r £ 0
Ha: r > 0

(B) Table statistic: t a,(n - 2)
(C) Computed value: t* = r / Ö[(1 - r²) / (n - 2)]
(D) This example shows r and t* not in the tail; thus, FTR(Support) Ho.
One Tail Hypothesis Test (Right) on Population Correlation Coefficient, r
Ho: r £ 0
Ha: r > 0
Reject Ho if t* > t a , (n - 2)
FTR(Support) Ho if t* £ t a , (n - 2)
![]() For Ho:
r
£ 0
can r be greater than zero and still support this hypothesis? Yes
No
(click one)
For Ho:
r
£ 0
can r be greater than zero and still support this hypothesis? Yes
No
(click one)
Go on to
Lesson 2: Examples
or
Go back to Correlation
Analysis: Activities and Assignments
Please reference "BA501 (your last name) Assignment name and number" in the subject line of either below.
E-mail Dr. James V. Pinto at
BA501@mail.cba.nau.edu
or call (928) 523-7356. Use WebMail for attachments.

Copyright 2002 Northern
Arizona University
ALL RIGHTS RESERVED