


 |
 |
 |
 |
  |
|
Excel and Equations

§ Scatter Diagram § Simple Linear Regression §
§ Regression line Slope, b1 § Regression line Intercept, b0 §
§ Regression § Trend for Regression § Trend line for Regression §
§ Forecast § Standard Error § t* and p-values and Hypothesis testing §
§ Confidence Interval for b1 § Coefficient of Determination §
§ Coefficient of Determinations using Paste Function §
§ Equations §
1. Scatter Diagram: Click Chart Wizard-XY Scatter.
![]()
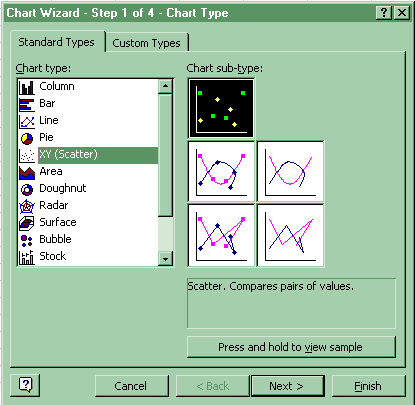
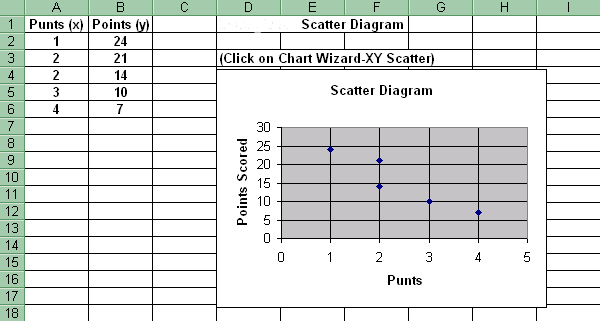
2. Simple Linear Regression
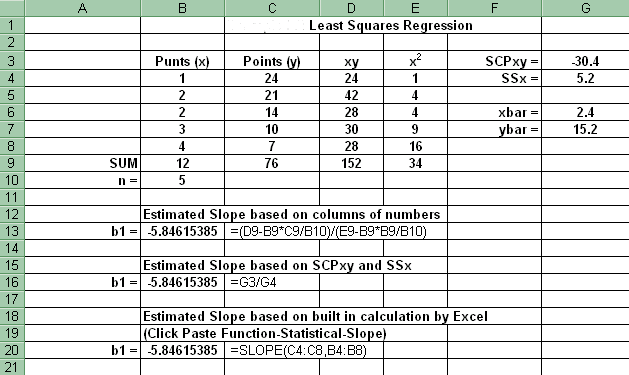
(a) Regression line Slope, b1- Click Paste Function-Statistical-Slope
![]()
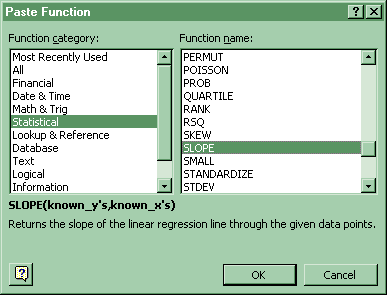
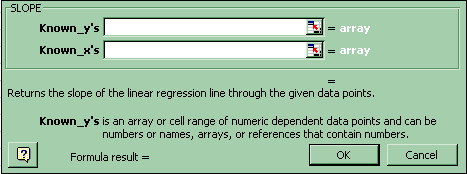
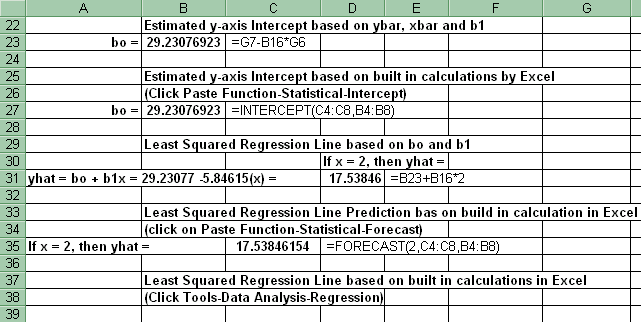
(b) Regression line Intercept, b0- Click Paste Function-Statistical-Intercept
![]()
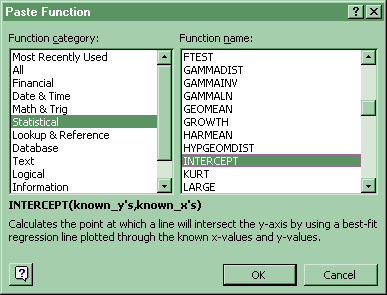
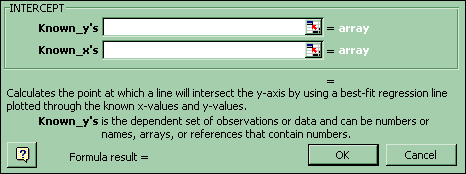
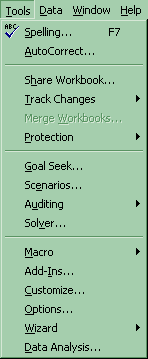
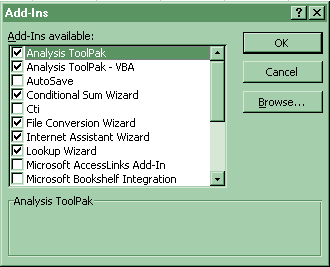
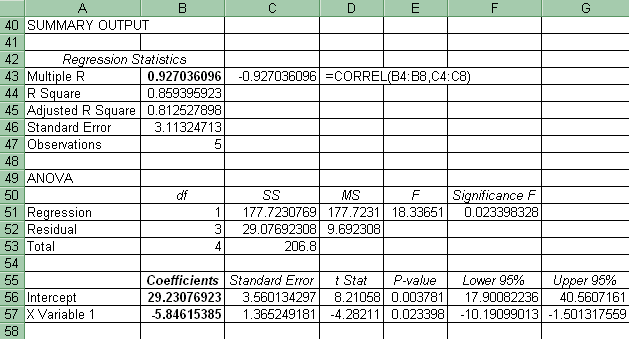
(c) Regression- Click Tools-Data Analysis-Regression If Data Analysis does not appear, then click Tools-Add-Ins and click the top two boxes, Analysis Toolpak and Analysis Toolpak-VBA.
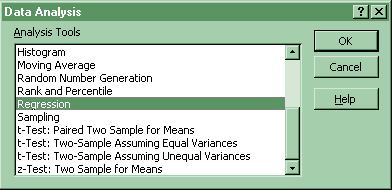
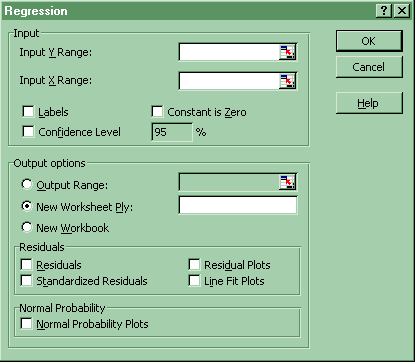
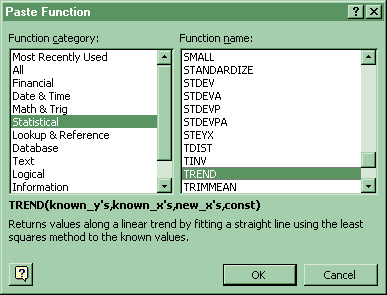
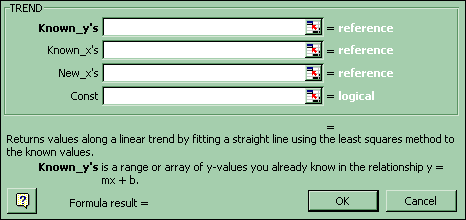
(d) Trend for Regression: Click Paste Function-Statistical-Trend
![]()
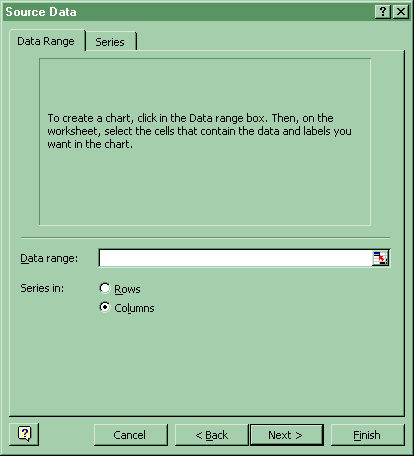
(e) Trend line for Regression: Click Chart Wizard-XY Scatter
![]()

(f) Forecast: Click Paste Function-Statistical-Forecast
![]()
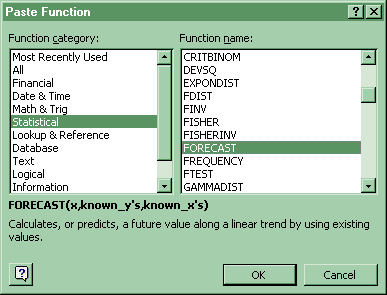
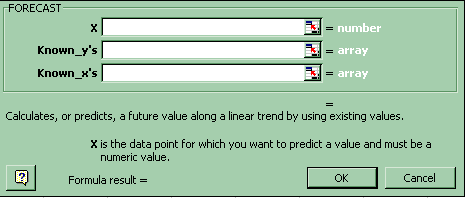
3. Standard Error: Click Tools-Data Analysis-Regression (look at the Standard Error in the first two blocks of numbers)
Problem: What is the relationship between the number of punts and the number of points scored in data gathered from 5 football games?
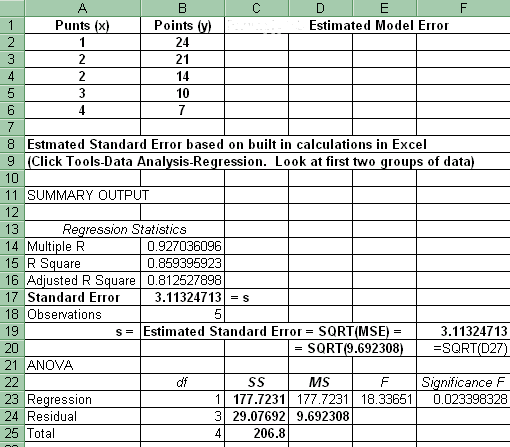
4. t* and p-values and Hypothesis testing: Click Tools-Data Analysis-Regression (look at t Stat and P-value in last block of numbers)
Ho: b1 => 0
Ha: b1 < 0
a = 0.10
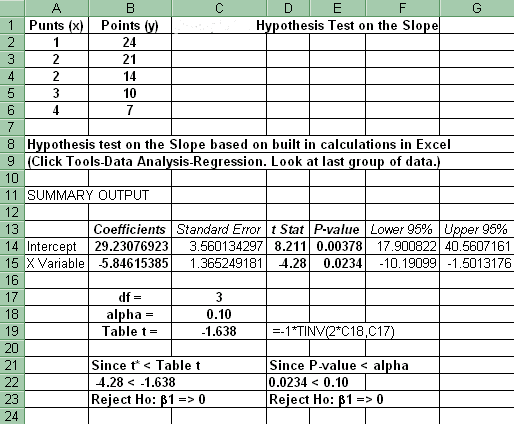
5. Confidence Interval for b1: Click Tools-Data Analysis-Regression (look at last group of numbers)
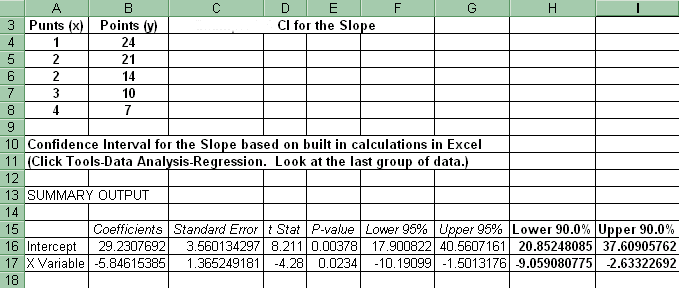
6. Coefficient of Determination: Click Tools-Data Analysis-Regression (look at first two groups of numbers). Also click Paste Function-Statistical-RSQ. (see below spreadsheet).
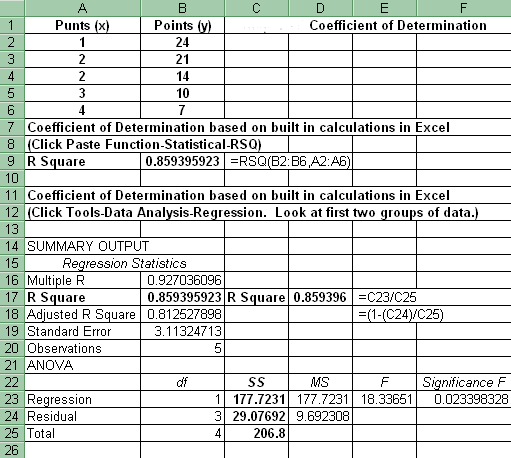
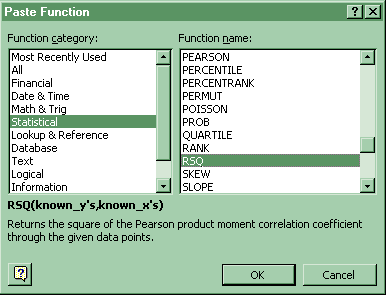
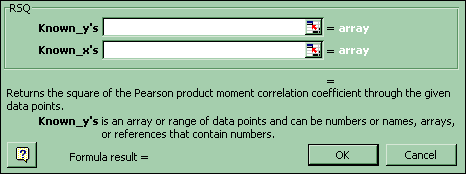
(a) Coefficient of Determinations using Paste Function: Click Paste Function-Statistical-RSQ
![]()
Equations
§ Sd² § b1 § § bo § Yhat § Y model § s² § t* with b1 §
§ Two Tail Hypothesis Test on the Slope of Regression Line, b1 §
§ One Tail Hypothesis Test (Right) on the Slope of Regression Line, b1 §
§ One Tail Hypothesis Test (Left) on the Slope of Regression Line, b1 §
§ CI for b1 § t* with r § SSy § r² § Sums of Squares §
1. d² = S(y -
yhat)² = SSE = SSy - [SCPxy]²
/ SSx
(a) SCPxy = [Sxy - (Sx)(Sy) / n])
(b) SSx = [Sx²-
(Sx)² / n]
(c) SSy = [Sy²-
(Sy)² / n]
2. b1
= D y / D x
= [Sxy - (Sx)(Sy)
/ n] / [Sx²-
(Sx)²
/ n]
= SCPxy / SSx
3. bo
= ybar - b1(xbar)
(a) xbar = Sx / n
(b) ybar = Sy
/ n
4. Yhat = bo + b1[x]
5. Y = bo
+ b1[X]
+ e
6. s² = s²e(hat) = estimate of s²e =
SSE / [n- 2 ] = MSE
s = Ös² = Ö(SSE
/ [n - 2]) = ÖMSE
7. t* = [b1 - b1] / Sb1 = [b1 - b1] / [ s / ÖSSx ]
Sb1 = s / ÖSSx
8. Two Tail Hypothesis Test on the Slope of the
Regression Line, b1
Ho: b1= 0
Ha: b1
¹ 0
Reject Ho if |t*| > t a / 2,(n
- 2)
FTR(Support) Ho if |t*| £ t a / 2,(n - 2)
9. One Tail Hypothesis Test (Right) on the Slope
of the Regression Line, b1
Ho: b1
£ 0
Ha: b1 > 0
Reject Ho if t* > t a, (n
- 2)
FTR(Support) Ho if t* £ t a, (n - 2)
10. One Tail Hypothesis Test (Left) on the Slope
of the Regression Line, b1
Ho: b1 ³ 0
Ha: b1 < 0
Reject Ho if t* < - t a, (n
- 2)
FTR(Support) Ho if t* ³ - t
a, (n - 2)
11. CI for b1 = b1 ± [t a / 2,(n - 2)]Sb1
12. t*
= r / Ö[(1 - r²) / (n - 2)]
13. SSy = SSR + SSE
14. r² = SSR / SSy
= 1 - SSE / SSy
= [SCPxy] 2 / (SSx)( SSy)
= (correlation coefficient)2 = (r)2
15. SSy = S( y - ybar)² = Sy² - (Sy)² / n
SSR = S(yhat - ybar )² = (SCPxy)²
/ [SSx]
SSE = S(y - yhat )² = SSy - [SCPxy]²/SSx
Go on to Regression:
Home Work
or
Go back to Regression
Analysis: Activities and Assignments
Please reference "BA501 (your last name) Assignment name and number" in the subject line of either below.
E-mail Dr. James V. Pinto at
BA501@mail.cba.nau.edu
or call (928) 523-7356. Use WebMail for attachments.

Copyright © 2002 Northern Arizona
University
ALL RIGHTS RESERVED