

 |
 |
 |
 |
  |
|
§ Lession 2: Examples §
(a) Problem: What is the relationship between the number of punts and the number of points scored in data gathered from 5 football games?
(b) Data: x = # of punts
y = # of points scored
|
xi |
yi |
|
|
1 |
24 |
|
|
2 |
21 |
|
|
2 |
14 |
|
|
3 |
10 |
|
|
4 |
7 |
(A) Data: x = # of punts
y = # of points scored
|
xi |
yi |
xiyi |
xi² |
|
|
|
1 |
24 |
24 |
1 |
|
|
2 |
21 |
42 |
4 |
|
|
2 |
14 |
28 |
4 |
|
|
3 |
10 |
30 |
9 |
|
|
4 |
7 |
28 |
16 |
|
Totals |
12 |
76 |
152 |
34 |
(B) Slope:
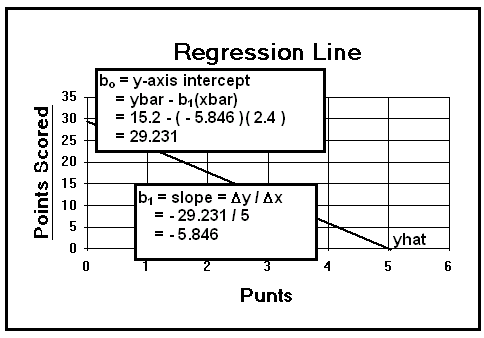
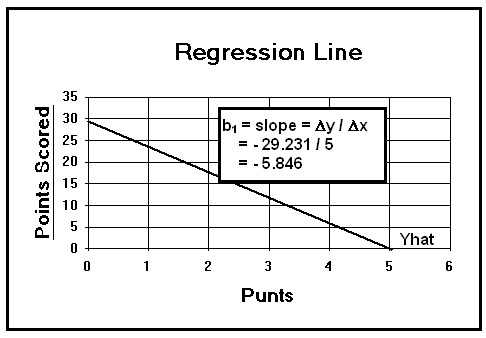
(1) b1 = D y / D x = - 29.231 / 5
= - 5.846 ![]() (click me)
(click me)
(I've cheated by using bo information which follows.)
(2) b1 = [S xy - (S x)(S y) / n] / [S x²- (S x)² / n]
= [ 152 - ( 12 )( 76 ) /5 ] / [ 34 - ( 12 )² / 5 ]
(3) b1 = SCPxy / SSx
= - 30.4 / [ 5.2 ]
= - 5.846
where,
(a) SCPxy = S xy - (S x)(S y) / n = - 30.4
(b) SSx = S x²- (S x)² / n = 5.2
(C) bo = y-intercept
= ybar - b1(xbar)
= 15.2 - ( - 5.846 )( 2.4 )
= 15.2 + ( 14.031 )
= 29.231
where,
(1) xbar = S x / n = 12 / 5 = 2.4
(2) ybar = S y / n = 76 / 5 = 15.2

(D) Least Squared Regression Line Equation
(1) Yhat = bo + b1[x] = 29,231 - [ 5.846
][x] ![]() (click me)
(click me)
(2) What is the expected (average) number of points scored when there are two punts during a game?
(3) yhat = 29.231- 5.846[x]
= 29.231 - 5.846[ 2 ]
= 29.231 - 11.692
= 17.539 = 18 points scored
(click me)
This example worked in Excel.
Example 2. The Simple Linear Regression Model Error: Punts and Points Scored
(A) Punts and Points Scored:
Data: x = # of punts
y = # of points scored
|
|
xi |
yi |
xiyi |
xi² |
yi² |
|
|
1 |
24 |
24 |
1 |
576 |
|
|
2 |
21 |
42 |
4 |
441 |
|
|
2 |
14 |
28 |
4 |
196 |
|
|
3 |
10 |
30 |
9 |
100 |
|
|
4 |
7 |
28 |
16 |
49 |
|
Totals |
12 |
76 |
152 |
34 |
1,362 |
= 206.8 - [ - 30.4 ]² / 5.2
= 206.8 - 924.16 / 5.2
= 206.8 - 177.73
= 29.08 ![]() (click me)
(click me)
where,
(1) SSy = [S y²- (S y)² / n] = 206.8
(2) SCPxy = [S xy - (S x)(S y) / n] = - 30.4
(3) SSx = [S x²- (S x)² / n] = 5.2
(C) s² = s ²e(hat) = estimate of s ²e
= SSE / [n - 2]
= 29.08 / [ 5 - 2]
= 9.69 = MSE
(D) s = Ö s² = Ö [s ²e(hat)] = Ö (SSE / [n - 2])
= Ö MSE = Ö 9.69 = 3.113
This example worked in Excel.
Example 3. Test of Hypothesis on the Slope of the Regression Line- Punts and Points Scored
(A) There appears to be a negative relationship between punts and points scored.

(B) One tail test: left
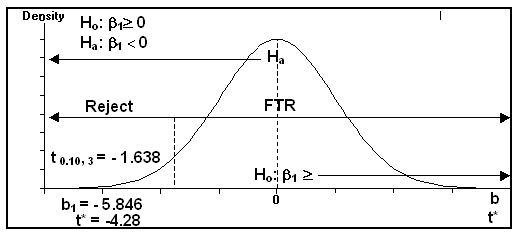
(1) One-tail left hypothesis:
Ho: b 1 ³ 0
Ha: b 1 < 0
(2) Table statistic: (critical value)
If a = 0.10,
then - t 0.10, ( 5 - 2) = - t0.10, 3 = - 1.638
(3) Computed statistic
t* = [b1 - b 1] / Sb1 = [b1 - b 1] / [s / Ö SSx]
= [ - 5.846 - 0 ] / [ 3.113 / Ö 5.2 ]
= [- 5.846] / 1.365
= - 4.28
where,
(a) s = Ö s² = Ö [s ²e(hat)] = Ö (SSE / [n - 2])
= Ö MSE = Ö 9.69 = 3.113
(b) SSx = [S x²- (S x)² / n] = 5.2
(c) Sb1 = s / Ö SSx = 3.113 / Ö 5.2 = 1.365 ]
(4) One Tail Hypothesis Test (Left) on the Slope of the Regression Line
Ho: b 1 ³ 0
Ha: b 1 < 0
Reject Ho if t* < - t a , (n - 2)
FTR(Support) Ho if t* ³ - t a , (n - 2)

(5) Since t* < - t 0.10, 3
- 4.28 < - 1.638, Reject Ho
(6) Since t* = - 4.28 < t0.10,3 = - 1.638, then b1 = - 5.846 is statistically so far away from Ho: b 1 ³ 0 that one can not believe Ho is true; thus, Reject Ho.
(7) Support Ha: b 1 < 0. The is a significant negative relationship between the number of punts and the number of points scored.
This example worked in Excel.
Example 4. Measuring the Strength of the Model: Coefficient of Determination for Punts and Points Scored
(A) Coefficient of Determination-
(1) Some Necessary Parts:
(a) SSy = S (y - ybar)² = S y² - (S y)² / n
= 206.8
(b) SSR = S (yhat - ybar)² = (SCPxy)² / [SSx]
= [ -30.4 ]² / 5.2 = 177.72
(c) SSE = S (y - yhat)²
= SSy - [SCPxy]² / SSx
= 206.8 - ( - 30.4 )² / 5.2
= SSy - SSR
= 206.8 - 177.72 = 29.08
where,
[1] SSy = S y² - (S y)² / n = 206.8
[2] SCPxy = S xy - (S x)(S y) / n = - 30.4
[3] SSx = S x²- (S x)² / n = 5.2
(B) Calculations:
(1) r² = SSR / SSy = 177.72 / 206.8 = 0.859 = 85.9%
(2) r² = 1 - SSE / SSy
= 1 - 29.08 / 206.8
= 1 - 0.141 = 0.859 = 85.9%
(3) Since r = SCPxy / Ö(SSx) Ö ( SSy) then
r2 = [SCPxy] 2 / (SSx)( SSy)
= [ -30.4 ]2 / ( 5.2 )( 206.8 )
= 0.859 = 85.9%
(4) r² = (correlation coefficient)2 = (r)2
= ( - 0.927 ) 2 = 0.859 = 85.9%
(C) Interpretation
(1) r² = 85.9% means 85.9% of the variation in points scored is explained by the variation in number of punts per game.
This example worked in Excel.
Go on to Regression
Analysis: Excel and Equations
or
Go back to Regression
Analysis: Activities and Assignments
Please reference "BA501 (your last name) Assignment name and number" in the subject line of either below.
E-mail Dr. James V. Pinto at
BA501@mail.cba.nau.edu
or call (928) 523-7356. Use WebMail for attachments.

Copyright © 2002 Northern
Arizona University
ALL RIGHTS RESERVED