


|
|
|
|
|
|
Statistical Process Control (SPC) uses statistical methods in order to track and analyze processes which in turn helps to control these processes.
§ Variation § Control Chart § Sample Size §
§ Variables Data § Attributes Data §
§ Control Limits vs. Specification Limits §
§ ![]() -Chart
§
Steps
for Creating an
-Chart
§
Steps
for Creating an ![]() -Chart
§
-Chart
§
§
![]() -Chart
Example §
R-Chart §
-Chart
Example §
R-Chart §
§ Steps for Creating an R-Chart § R-Chart Example §
§ P-Chart § Steps for Creating a P-Chart §
§ P-Chart Example §
Variation
There are two kinds of process variation. Natural variations (or common causes) are variations that occur randomly in nature and can not be controlled. Natural variations affect all processes and are thus tolerated. Assignable variations are caused by a specific event and can be controlled. Examples of assignable variations could be tool wear, lack of preventive maintenance, poor operator training, defective raw material, etc…
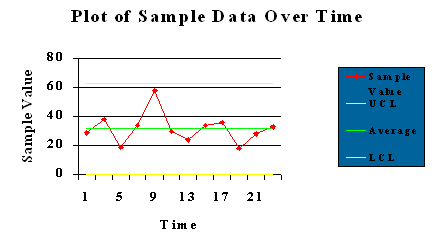
The control chart graphically represents process data over time. The purpose of the control chart is to help determine if a process is in control. A control chart is comprised of the following components:
· Upper Control Limits (UCL): The calculated upper limit of the control chart.
· Lower Control Limit (LCL): The calculated lower limit of the control chart.
· Center Line: Typically the mean of the samples.
· Data Points: These are the points that are plotted on the control chart.
And example of a control chart follows below.
Sample Size
Because SPC has
its foundations in statistics, the data analyzed will be based on the averages
of small samples (sample size greater than 5) so that the central limit
theorem can apply (![]() -Chart,
R-Chart, and P-Chart only). In general terms, the central limit theorem
states that regardless of the distribution of the population of all parts
or services, the distribution of averages will tend to follow a normal distribution
as the sample size grows larger.
-Chart,
R-Chart, and P-Chart only). In general terms, the central limit theorem
states that regardless of the distribution of the population of all parts
or services, the distribution of averages will tend to follow a normal distribution
as the sample size grows larger.
Variables data involves objects of continuous dimensions, or an infinite number of possibilities. So, Variables data requires measuring some characteristic of an object. Examples of Variables data would be:
· Weight
· Height
· Width
· Speed
Variables data
can be monitored with either an ![]() -Chart
or an R-Chart.
-Chart
or an R-Chart.
Unlike Variables data, Attributes data can be classified as either defective or non-defective (discrete). Measuring attributes data basically involves counting the number of defectives and tallying the result. Examples of Attributes data would be:
· Counting the number of scratches per door on a car
· Counting the number of nicks on the surface of a table
· Counting the number of integrated circuits that passed final inspection
· Counting the number of tires that passed/failed the weight test
Attributes data can be monitored with a P-Chart.
Control limits are a direct result of the process capability. Therefore, control limits CAN NOT be established before hand. Control limits require data directly from a process. Conversely, Specification Limits are pre-determined design goals for a process (engineering design parameters). So, Specification Limits can not be substituted for Control Limits and Control Limit can not be substituted for Specification Limits.
![]() -Chart
-Chart
The ![]() -Chart
is used for Variables data and tracks the sample mean of a process.
For example, let’s say a manufacturer of yard sticks has noticed variability
problems with the yard stick lengths. This manufacturer could use
an
-Chart
is used for Variables data and tracks the sample mean of a process.
For example, let’s say a manufacturer of yard sticks has noticed variability
problems with the yard stick lengths. This manufacturer could use
an ![]() -Chart
to track the yard stick lengths. The manufacturer would determine
the number of yard sticks that would constitute a sample (say 10).
Then, each sample of ten yard stick lengths would be averaged. This
set sample means would then serve as the basis for the yard stick length
-Chart
to track the yard stick lengths. The manufacturer would determine
the number of yard sticks that would constitute a sample (say 10).
Then, each sample of ten yard stick lengths would be averaged. This
set sample means would then serve as the basis for the yard stick length
![]() -Chart.
-Chart.
Steps for
Creating an ![]() -Chart
-Chart
Step 1.
Calculate the center line, ![]() (mean of all sample means).
(mean of all sample means).
Step 2. Determine A2 from Table SPC-1:
Table
SPC-1: ![]() -Chart
and R-Chart Factors
-Chart
and R-Chart Factors
|
Sample
Size n |
Mean
Factor A2 |
Upper
Range D4 |
Lower
Range D3 |
|
2 |
1.880 |
3.268 |
0 |
|
3 |
1.023 |
2.574 |
0 |
|
4 |
0.729 |
2.282 |
0 |
|
5 |
0.577 |
2.115 |
0 |
|
6 |
0.483 |
2.004 |
0 |
|
7 |
0.419 |
1.924 |
0.076 |
|
8 |
0.373 |
1.864 |
0.136 |
|
9 |
0.337 |
1.816 |
0.184 |
|
10 |
0.308 |
1.777 |
0.223 |
Step 3. Calculate the upper and lower control limits:
![]()
![]()
where:
![]() = Upper Control Limit
= Upper Control Limit
![]() -Chart
-Chart
![]() = Lower Control Limit
= Lower Control Limit
![]() -Chart
-Chart
![]() = Mean of Sample Means
= Mean of Sample Means
![]() = Mean of Sample Ranges (the
Range for a set of data is the
= Mean of Sample Ranges (the
Range for a set of data is the
difference between the maximum and minimum values within that data set).
A2 = Mean Factor from Table SPC-1
Step 4.
Draw the ![]() Control
Chart: The data points will be the individual sample means.
Control
Chart: The data points will be the individual sample means.
Step 5. Interpret the Control Chart: Determine if the process is in control or not. Additionally, determine if the process is showing a trend of approaching lack of control.
![]() -Chart
Example
-Chart
Example
Assume the following measurements of a pipe diameter are available:
Table
SPC-2: Pipe Diameter Data
|
|
Observation |
|
|||||||
|
Sample
( i ) |
1 |
2 |
3 |
4 |
5 |
|
|
||
|
1 |
5.02 |
5.01 |
4.94 |
4.99 |
4.96 |
4.98 |
0.08 |
||
|
2 |
5.01 |
5.03 |
5.07 |
4.95 |
4.96 |
5.00 |
0.12 |
||
|
3 |
4.99 |
5.00 |
4.93 |
4.92 |
4.99 |
4.97 |
0.08 |
||
|
4 |
5.03 |
4.91 |
5.01 |
4.98 |
4.89 |
4.96 |
0.14 |
||
|
5 |
4.95 |
4.92 |
5.03 |
5.05 |
5.01 |
4.99 |
0.13 |
||
|
6 |
4.97 |
5.06 |
5.06 |
4.96 |
5.03 |
5.02 |
0.10 |
||
Table SPC-2 above
is comprised of six samples of data. Each sample contains five observations
(so the sample size is five, n=5). In other words, five pipes were
selected randomly from the manufacturing system and had their diameters
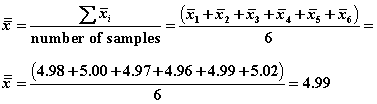
measured for each sample. For each sample, the sample mean (![]() ) and the sample range
(
) and the sample range
(![]() ) were calculated.
) were calculated.
Step 1.
Calculate the center line, ![]() .
.
Step 2. Determine A2 from Table SPC-1.
For this example, the sample size is 5, so n=5, therefore A2 = 0.577
Step 3. Calculate the upper and lower control limits.
First, we need to calculate ![]() :
:
Next, we need to calculate the upper and lower control limits:
![]()
![]()
Step 4.
Draw the ![]() Control
Chart.
Control
Chart.
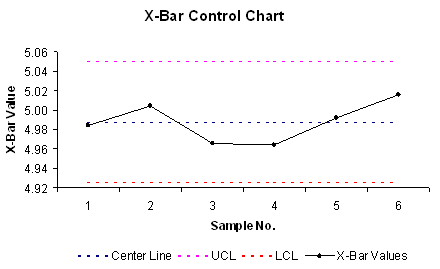
Step 5. Interpretation of Control Chart: By looking at the control chart, all data points (x-bar values) fall within the Upper Control Limit (UCL) and Lower Control Limit (LCL). Additionally, there does not appear to be any significant trend upward or downward. However, a possible trend upward could be starting for the last three samples which could deserve further investigation of the process. Therefore, we can state that this process (for sample means) is in control.
Click Here to View an Excel version of this example
The R-Chart is used for Variables Data and tracks the Range of a process.
Steps for Creating an R-Chart
Step 1.
Calculate the center line ![]() (mean of all sample
Ranges).
(mean of all sample
Ranges).
Step 2. Determine D4 and D3 from Table SPC-1 for the respective sample size. Remember, the sample size is the number of observations per sample, NOT the number of samples in the problem.
Step 3. Calculate the upper and lower control limits:
![]()
![]()
Step 4. Draw the R control chart.
Step 5. Interpret the control chart.
R-Chart Example
Let’s continue
with the pipe diameter example from above (Table SPC-2). In this case,
the manufacturer is concerned with the Range for the pipe diameters.
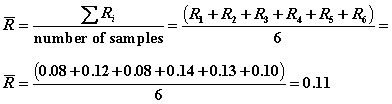
From Table SPC-2, each sample Range was calculated under the column ![]() .
.
Step 1.
Calculate the center line ![]() .
.
Step 2. Determine D4 and D3 from Table SPC-1 for the respective sample size. In the case, the sample size is five, n=5. So, D4 = 2.115 and D3 = 0.
Step 3. Calculate the upper and lower control limits:
![]()
![]()
Step 4. Draw the R control chart.
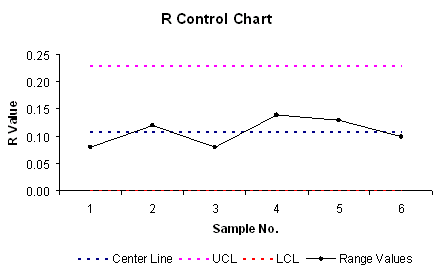
Step 5. Interpret the control chart: By looking at the R-Chart, the LCL resides at zero and the UCL resides at 0.23. The R Values are oscillating around the center line and zero R Values are outside of the control limits. Therefore, this process is in control.
Click Here to View an Excel version of this example
The P-Chart is used for Attributes Data and tracks the proportion defective per sample of a process.
Steps for Creating a P-Chart
Step 1.
Calculate the center line ![]() , the average proportion defective.
, the average proportion defective.
Step 2.
Calculate the standard deviation ![]() :
:
![]() , where n = the sample size.
, where n = the sample size.
Step 3. Calculate the upper and lower control limits:
![]()
![]()
where,
z = the number of standard deviations.
NOTE: The value of z is typically 3. With z = 3, 99.7% of the random variation will be included within the control limits.
Step 4. Draw the P-Chart.
Step 5. Interpret the control chart.
The following data from a bowling ball manufacturer is available. This data reflects the number of defective bowling balls found per sample of 100 bowling balls each (so, sample size = n = 100):
|
Sample
( i ) |
No. of Defectives per Sample |
Sample
Proportion Defective (pi) |
|
1 |
6 |
6/100 = 0.06 |
|
2 |
15 |
15/100 = 0.15 |
|
3 |
4 |
4/100 = 0.04 |
|
4 |
10 |
10/100 = 0.10 |
|
5 |
6 |
6/100 = 0.06 |
|
6 |
4 |
4/100 = 0.04 |
|
7 |
12 |
12/100 = 0.12 |
Generate a P-Chart so that 99.7% of the random variation is accounted for within the control limits. For each of the above samples, the sample proportion defective was calculated as follows:
![]()
Remember, the sample size = 100 and seven samples were collected.
Step
1. Calculate the center line ![]() , the average proportion defective:
, the average proportion defective:
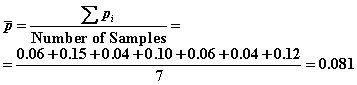
Step 2.
Calculate the standard deviation ![]() :
:
![]()
Remember, the sample size, n, is 100. Which is different than the number of samples which is 7.
Step 3. Calculate the upper and lower control limits:
![]()
![]()
Remember, z = 3 because the example asked for the control limits to accommodate 99.7% of the random variation.
Step 4. Draw the P-Chart.
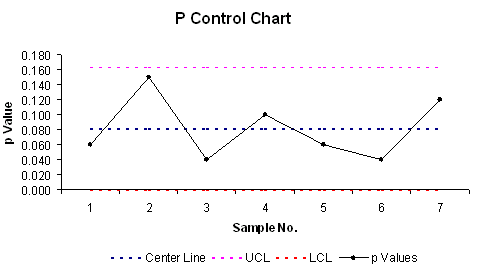
Step 5. Interpret the Control Chart: As can be seen above, the p Values (proportion defectives) are well within the upper and lower control limits. Therefore, this process is considered in control.
Click Here to View an Excel version of this example
Go on to Statistical
Process Control: Home Work
or
Go back to Statistical
Process Control: Activities and Assignments
Please reference "BA501 (your last name) Assignment name and number" in the subject line of either below.
E-mail Dr. Rakesh Pangasa at
BA501@mail.cba.nau.edu
or call (928) 344-7588. Use WebMail for attachments.

Copyright © 2002 Northern
Arizona University
ALL RIGHTS RESERVED