

 |
 |
 |
 |
  |
|
§ Excel and Equations §
Excel- commands used in this topic (Excel in Office 97 and Office 2000)

§ Sample Mean § Population Mean § Median §
§ Mode § Range § Sample Variance §
§ Population Variance § Sample Standard Deviation §
§ Population Standard Deviation § Z Score §
§ Equations §
Excel Steps-
Sample Mean
(1) Use the paste function on the tool bar. Click Paste Function-Statistical-Average.
![]()


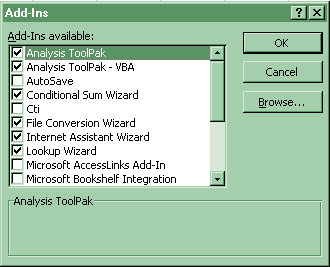
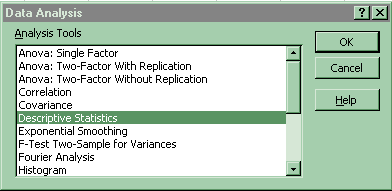
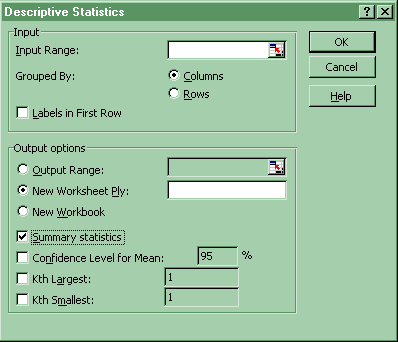
(2) Click on Tools-Data Analysis-Descriptive Statistics-Summary Statistics . If Data Analysis does not show up, then click on Tools-Addins and select the top two options of Analysis Pack and Analysis Pack VBA.


Population Mean
Use the paste function on the tool bar. Click Paste Function-Statistical-Average. (See Sample Mean above)
Median
(1) Use the paste function on the tool bar. Click Paste Function-Statistical-Median.
![]()


(2) Click on Tools-Data Analysis-Descriptive Statistics-Summary Statistics . If Data Analysis does not show up, then click on Tools-Addins and select the top two options of Analysis Pack and Analysis Pack VBA. (See Sample Mean (2) above)
Mode
(1) Use the paste function on the tool bar. Click Paste Function-Statistical-Mode.
![]()


(2) Click on Tools-Data Analysis-Descriptive Statistics-Summary Statistics . If Data Analysis does not show up, then click on Tools-Addins and select the top two options of Analysis Pack and Analysis Pack VBA. (See Sample Mean (2) above)
Range
Click on Tools-Data Analysis-Descriptive Statistics-Summary Statistics . If Data Analysis does not show up, then click on Tools-Addins and select the top two options of Analysis Pack and Analysis Pack VBA. (See Sample Mean (2) above)

Sample Variance
(1) Use the paste function on the tool bar. Click Paste Function-Statistical-Var.
![]()


(2) Click on Tools-Data Analysis-Descriptive Statistics-Summary Statistics . If Data Analysis does not show up, then click on Tools-Addins and select the top two options of Analysis Pack and Analysis Pack VBA. (See Sample Mean (2) above)
Population Variance
Use the paste function on the tool bar. Click Paste Function-Statistical-VarP.
![]()


Sample Standard Deviation
(1) Use the paste function on the tool bar. Click Paste Function-Statistical-Stdev.
![]()


(2) Click on Tools-Data Analysis-Descriptive Statistics-Summary Statistics . If Data Analysis does not show up, then click on Tools-Addins and select the top two options of Analysis Pack and Analysis Pack VBA. (See Sample Mean (2) above)
Population Standard Deviation
Use the paste function on the tool bar. Click Paste Function-Statistical-StdevP.
![]()


Z Score
Click Paste Function-Statistical-Standardize
![]()


Descriptive Measures
Equations
§ Sum of Deviations § Sample Mean § Population Mean §
§ Median § Range § Sum of the Squared Deviations §
§ Variance § Standard Deviation § Empirical Rule §
§ Z Score § Other Equations not found at this topic site §
Equations found at this topic site:
1. Sum of Deviations
Sd = S(x - xbar) = 0
d = individual deviation
x = data value
xbar = sample mean =

2. Sample Mean
xbar = Sx / n =

S means sum
x = data value
n = number of data values in sample
3. Population Mean
m = Sx / N
S means sum
x = data value
N = number of data values in the population
4. Median
= Md
(a) When n is odd,
Md = (n + 1) / 2 position in order array (find data value in that position)
(b) When n is even,
Md = (two middle values) / 2
5. Range
= high data value - low value
R = H - L
6. Sum of the Squared Deviations
Sd² = S(x - xbar)²
d² = (individual deviation) ²
x = data value
xbar = sample mean =

7. Variance
(a) Conceptual Formulae:
(1) Conceptual Formula Sample Variance
s² = Sd² / (n - 1) = S(x - xbar)² / (n - 1)
(not for hand calculations)
S means sum
d² = (individual deviation)² = (x - xbar)²
n = number of data values in sample
xbar = Sx / n = sample mean =
x = data value
(n - 1) = degrees of freedom
(2) Conceptual Formula Population Variance
s² = S(x - m)² / N
S means sum
x = data value
m = Sx / N = population mean
N = number of data values in population
(b) Computing Formula Sample Variance
s² = [Sx² - (Sx)² / n] / (n - 1) (use for hand calculations)
x = data value
n = number of data values in sample
8. Standard Deviation
(a) Conceptual Formula Sample Standard Deviation
Sample s = Ö[s²] = Ö[Sd² / (n - 1)]
= Ö[S(x - xbar)² / (n - 1)]
(not for hand calculations)
Ö = square root
S means sum
d² = (individual deviation)² = (x - xbar)²
n = number of data values in sample
xbar = Sx / n = sample mean =
x = data value
(n - 1) = degrees of freedom
(b) Computing Formula Sample Standard Deviation
s = Ös² = Ö{[Sx² - (Sx)² / n] / (n - 1)}
(use for hand calculations)
x = data value
n = number of data values in sample
9. Empirical Rule
(a) 68% of data values between xbar ± s
(b) 95% of data values between xbar ± 2s
(c) 99.7% of data values between xbar ± 3s
10. Z Score
Z = [x - xbar] / s
x = data value
xbar = mean (sample) =
[x - xbar] = individual deviation
s = standard deviation (the average deviation)
Other Equations not found at this topic site:
§ Midrange § Mean Absolute Deviation §
§ Percentile § Interquartile Range §
§ Pearsonian Coefficient of Skewness §
§ Grouped Data § Coding Data §
1. Midrange
Mr = the average of the lowest (L)
and highest (H) data values.
Mr = [(L) + (H)] / 2
2. Mean Absolute Deviation
MAD = (S|x - xbar|) / n
S means sum
x = data value
xbar = Sx / n = sample mean =
n = number of data values in sample
3. Coefficient of Variation
CV = [s / xbar]100
s = sample standard deviation
xbar = sample mean =

4. Percentile
P(%) = [ n ][% / 100 ]
% = the percentile
n = number of data
P(%) = position in ordered array
5. Interquartile range
IQR = 3rd Quartile - 1st Quartile
6. Pearsonian coefficient of skewness-
Sk = 3[xbar - Md] / s
xbar = sample mean =

Md = median
s = sample standard deviation
7. Chebyshev's Inequality-
(a) At least 75% of data values between xbar ± 2s
(b) At least 89% of data values between xbar ± 3s
xbar = sample mean =

s = sample standard deviation
8. Approximating statistics from grouped data
(a) Sample Mean, xbar =
![]()
xbar » [Sf(m)] / n,
f is the class frequency
m is the class midpoint
n is the sample size
(b) Sample Standard Deviation, s
s » Ö{ [Sf(m)² - (Sfm)² / n] / [n - 1] },
f is the class frequency
m is the class midpoint
n is the sample size
10. Coding Data Values
(a) Rules for Subtraction and Addition of C:
(1) If C subtracted from original data:
actual xbar = xbaradj + C
Sadj = actual S
(2) If C added from original data:
actual xbar = xbaradj - C
Sadj = actual S
(b) Rules for Multiplication and Division by C:
(1) If C divided into original data:
actual xbar = [xbaradj ] [ C ]
actual S = [Sadj ] [C]
(2) If original data multiplied by C:
actual xbar = [xbaradj ] / [ C ]
actual S = [Sadj ] / [C]
You should now:Go on to Home Work
or
Go back to Descriptive Measures: Activities and Assignments
Please reference "BA501 (your last name) Assignment name and number" in the subject line of either below.
E-mail Dr. James V. Pinto at BA501@mail.cba.nau.edu
or call (928) 523-7356. Use WebMail for attachments.

Copyright 2002 Northern Arizona University
ALL RIGHTS RESERVED