


 |
 |
 |
 |
  |
|
§ Excel and Equations §
Excel Commands- Excel in Office 97 and Office 2000
§ Correlation Coefficient (A) § Correlation Coefficient (B) §
§ Correlation Coefficient (C) § Data and Spreadsheet §
§ Two-Tailed Hypothesis Test § One Tail (Right) Hypothesis Test §
§ One Tail (Left) Hypothesis Test § Equations §
1. Correlation Coefficient
(A) Click the Paste Function-Statistical-Correl
![]()
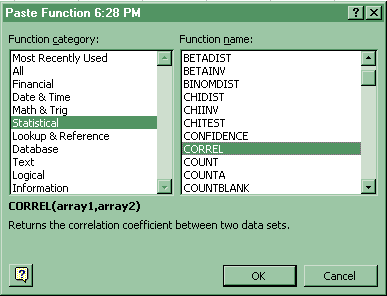
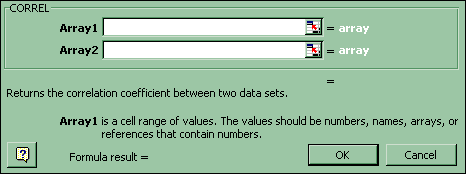
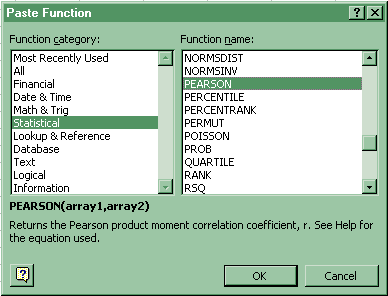
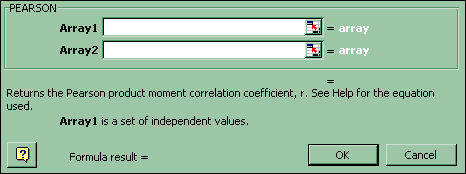
(B) Click Paste Function-Statistical-Pearson
![]()
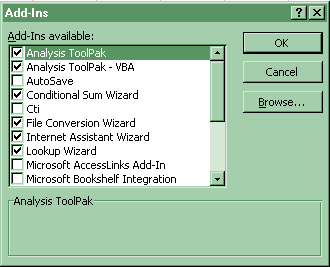
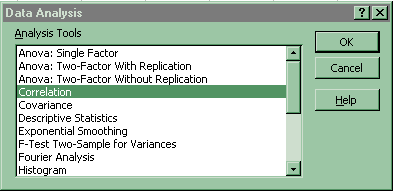
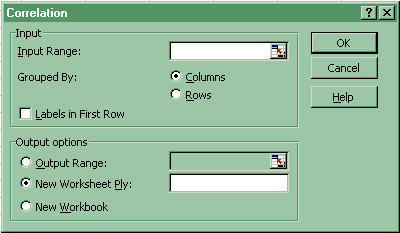
(C) Click Tools-Data Analysis-Correlation. If Data Analysis does not appear, then click Tools-Add-Ins and click the top two boxes, Analysis Toolpak and Analysis Toolpak-VBA.

2. Data and Spreadsheet for Hypothesis Testing on the Population Correlation Coefficient, Rho
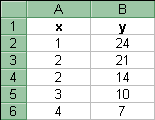
(A) Data:
(B) Spreadsheet:

(1) Correlation Coefficient. Click Paste Function-Statistical-Correl (as in 1. Correlation Coefficient above). A2:A6 and B2:B6 are the data. The D5 cell formula or r looks like the following:

(2) Calculated t*. D5 is the correlation coefficient, r. D7 is the number of ordered pairs, n. The D11 cell formula for t* looks like the following:

3. Two-Tailed Hypothesis Test on the Population Correlation Coefficient, Rho

(A) Table t values. D9 is alpha. D10 is the degrees of freedom. The table t scores found in cell E29 have the following formula:

(B) P-value: D11 is t*. D10 is degrees of freedom. The p-value found in cell E30 is given by the following formula:

(C) Decision: E30 is the p-value. D9 is alpha. The hypothesis decision found in cell E31 has the following formula:

4. One Tail (Right) Hypothesis Test on the Population Correlation Coefficient, Rho
![]() (click me)
(click me)

(A) Table t value. D9 is alpha. D10 is the degrees of freedom. The table t score found in cell E23 has the following formula:

(B) P-value: D11 is t*. D10 is degrees of freedom. The p-value found in cell E24 is given by the following formula:

(C) Decision: E24 is the p-value. D9 is alpha. The hypothesis decision found in cell E25 has the following formula:

5. One Tail (Left) Hypothesis Test on the Population Correlation Coefficient, Rho
![]() (click me)
(click me)

(A) Table t value. D9 is alpha. D10 is the degrees of freedom. The table t score found in cell E15 has the following formula:

(B) P-value: D11 is t*. D10 is degrees of freedom. The p-value found in cell E16 is given by the following formula:

(C) Decision: E16 is the p-value. D9 is alpha. The hypothesis decision found in cell E17 has the following formula:

§ Equations §
§ Correlation Coefficient § Calculated t §
§ Two Tail Hypothesis Test § One Tail Hypothesis Test (Right) §
§ One Tail Hypothesis Test (Left) §
1. Correlation Coefficient
r = S[x - xbar][y - ybar] / [Ö S(x - xbar)²][Ö S(y - ybar)²]
= [S xy - (S x)(S y) / n] / Ö [S x² - (S x)² / n]Ö [S y² - (S y)² / n]
= SCPxy / Ö [SSx ]Ö [SSy ]
(a) SCPxy = [S xy - (S x)(S y) / n])
(b) SSx = [S x²- (S x)² / n]
(c) SSy = [S y²- (S y)² / n]
2. t* = r / Ö[(1 - r²) / (n - 2)]
3. Two Tail Hypothesis Test on the Correlation Coefficient, r
Ho: r = 0
Ha: r ¹ 0
Reject Ho if |t*| > t a / 2,(n - 2)
FTR(Support) Ho if |t*| £ t a / 2,(n - 2)
4. One Tail Hypothesis Test (Right) on the Population Correlation Coefficient, r
Ho: r £ 0
Ha: r > 0
Reject Ho if t* > t a , (n - 2)
FTR(Support) Ho if t* £ t a , (n - 2)
5. One Tail Hypothesis Test (Left) on the Population Correlation Coefficient, r
Ho: r ³ 0
Ha: r < 0
Reject Ho if t* < - t a ,(n - 2)
FTR(Support) Ho if t* ³ - t a ,(n - 2)
Go on to Home
Work
or
Go back to Correlation
Analysis: Activities and Assignments
Please reference "BA501 (your last name) Assignment name and number" in the subject line of either below.
E-mail Dr. James V. Pinto at
BA501@mail.cba.nau.edu
or call (928) 523-7356. Use WebMail for attachments.

Copyright 2002 Northern
Arizona University
ALL RIGHTS RESERVED