|
|
|
|
|
|
§ Lession 2: Examples §
Example 1- Correlation: Punts and Points Scored
(A) Application of the correlation analysis-
(1) Problem: What is the relationship between the number of punts and the number of points scored in data gathered from 5 football games?
(2) Data: x = # of punts
|
xi |
yi |
|
1 |
24 |
|
2 |
21 |
|
2 |
14 |
|
3 |
10 |
|
4 |
7 |
(3) Look at the plotted data.
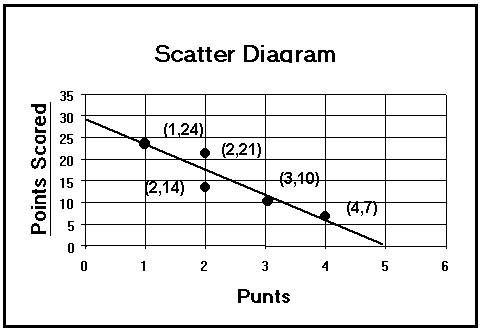
(a) Negative ( inverse ) relationship between the number of punts (x) and the number of points scored (y).
(b) Data:
|
xi |
yi |
xiyi |
xi² |
yi² |
|
|
|
1 |
24 |
4 |
1 |
576 |
|
|
2 |
21 |
42 |
4 |
441 |
|
|
2 |
14 |
28 |
4 |
196 |
|
|
3 |
10 |
30 |
9 |
100 |
|
|
4 |
7 |
28 |
16 |
49 |
|
Totals |
12 |
76 |
152 |
34 |
1,362 |
[1] r = [S xy - (S x)(S y) / n] / Ö [S x² - (S x)² / n]Ö [S y² - (S y)² / n]
= [152 - (12)(76) /5] /Ö [ 34 - (12)² /5]Ö [ 1,362- (76)²/ 5]
[2] = SCPxy / Ö [SSx] Ö [SSy]
= - 30.4 / Ö [5.2]Ö [ 206.8 ]
= - 30.4 / [2.28][14.38] = - 30.4 / 32.79
= - 0.927
where,
[a] SCPxy = [S xy - (S x)(S y) / n] = - 30.4
[b] SSx = [S x²- (S x)² / n] = 5.2
[c] SSy = [S y²- (S y)² / n] = 206.8
(c) r = - 0.927 indicates
a strong negative linear relationship between x and
y (the number of punts and the number of points scored).
![]() (click me)
(click me)
![]() Is it obvious from this example that the number of punts per game helps determine
the number of points scored? Yes
No
(chick one)
Is it obvious from this example that the number of punts per game helps determine
the number of points scored? Yes
No
(chick one)
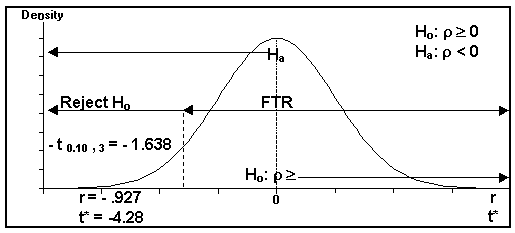
Example 2- Hypothesis Testing on the Populating Correlation, r : Punts and Points Scored
(A) One tail test (left) on r using data from Example 1:
![]() (click me)
(click me)
(1) Problem: Is there a statistically significant linear relationship between the number of punts and the number of points scored in data gathered from 5 football games? Test the claim that the population correlation coefficient for r is negative.
(2) One-tail left hypothesis:
Ho: r ³ 0
Ha: r < 0
(3) Table statistic:
If a = 0.10,
then t 0.10,(5 - 2) = t 0.10, 3 = - 1.638
(4) Computed value:
t* = r / Ö[(1 - r²) / (n - 2)]
= - 0.927 / Ö [(1- (- 0.927)²) / (5- 2)]
= - 4.28
(5) Since t* < - t 0.10,3
-4.28 < - 1.638, reject Ho
(6) One Tail Hypothesis Test (Left) on the Population
Correlation Coefficient, r
Ho: r ³0
Ha: r < 0
Reject Ho if t* < - t a ,(n - 2)
FTR(Support) Ho if t* ³ - t a ,(n - 2)
(7) Since t* = - 4.28 < t 0.10,3 = - 1.638, then r = - 0.927 is statistically so far away from Ho: r ³ 0 that one can not believe Ho is true; thus, reject Ho.
(8) FTR (Support) Ha: r < 0. There is a significant negative linear relationship between the number of punts and the number of points scored.
![]() Why is the alternative hypothesis in this problem Ha:
r
< 0? (a) the
researcher believes there is a neagive relationship (b) the
only possible relationship is negative. (chick
one)
Why is the alternative hypothesis in this problem Ha:
r
< 0? (a) the
researcher believes there is a neagive relationship (b) the
only possible relationship is negative. (chick
one)
Go on to Excel
and Equations
or
Go back to Correlation
Analysis: Activities and Assignments
or
Go back to Lession
1: Introduction
Please reference "BA501 (your last name) Assignment name and number" in the subject line of either below.
E-mail Dr. James V. Pinto at
BA501@mail.cba.nau.edu
or call (928) 523-7356. Use WebMail for attachments.

Copyright 2002 Northern
Arizona University
ALL RIGHTS RESERVED