


 |
 |
 |
 |
  |
|
§ Descriptive Graphs §
Lesson 2- Examples
Descriptive Graphs
§ 1. Frequency Distribution Continuous Data §
§ 2. Class Midpoint § 3. Frequency Distribution Discrete Data §
§ 4. Histogram § 5. Frequency Polygon §
§ 8. Bar Chart and Pie Chart for Nominal Data §
Example 1:
Frequency Distributions for Continuous Data
DATA> 1601, 1000,1902, 1715, 1339, 1502, 1399, 1115, 2000, 1589, 1138, 1269, 1627, 1510, 1700, 1851, 1679, 1200, 1672, 1314
(1) Ordered array: the data in order from lowest to highest values (or vise versa)
1000, 1115, 1138, 1200, 1269,1314, 1339, 1399, 1502, 1510, 1589, 1601, 1627, 1672, 1679, 1700, 1715, 1851, 1902, 2000
CW = (H - L) / K = ( 2000 - 1000 ) / 6
= 1000 / 6 = 166.7 (CW = class width)
(a) 166.7 is the minimum class width necessary to capture all data values .
(b) Round CW up from 166.7 to 170.
Download Excel Worksheet
|
Class # |
LCL |
UCL |
f |
f / n = |
rf |
|
1. |
1000 - |
1170 |
3 |
3 / 20 = |
0.15 |
|
2. |
1170 - |
1340 |
4 |
4 / 20 = |
0.20 |
|
3. |
1340 - |
1510 |
2 |
2 / 20 = |
0.10 |
|
4. |
1510 - |
1680 |
6 |
6 / 20 = |
0.30 |
|
5. |
1680 - |
1850 |
2 |
2 / 20 = |
0.10 |
|
6. |
1850 - |
2020 |
3 |
3 / 20 = |
0.15 |
n = Sf = 20 Srf = 1.00 LCL = Lower Class Limit UCL = Upper Class Limit
(2) The Greek letter S "S" means sum.
The true/false and fill-in-the-blank questions in the topic lessons are not being graded. They are designed to give positive feedback no matter what answer you give.
![]() The lower class limit of the first class must begin with the lowest data value
in the data set. True
False
(click one)
The lower class limit of the first class must begin with the lowest data value
in the data set. True
False
(click one)
Example 2:
Class Midpoint (using data in Example 1)
Class midpoint = CM = the middle value in a class
(1) CM = (LCL + UCL) / 2
(2) Example:
CM(6th) = ( 1850 + 2020 ) / 2
= ( 3870 ) / 2
= 1935
![]() One could represent a frequency distribution by specifying the class midpoint
instead of the LCL and UCL of each class. True
False
(click one)
One could represent a frequency distribution by specifying the class midpoint
instead of the LCL and UCL of each class. True
False
(click one)
Example 3:
Frequency Distribution for Discrete Data
DATA> 18,13, 24, 48, 1, 37, 5, 28,15,12
(1) Ordered array:
1,5,12,13,15,18,24,28,37, 48
If k = 5
(2) Class width = CW = (H - L) / k
= ( 48 - 1 ) / 5
= ( 47 ) / 5
= 9.4 (round up to 10)
|
Class # |
LCL |
to |
UCL |
f |
f / n = |
rf |
|
1. |
0 |
to |
9 |
2 |
2/10 = |
0.20 |
|
2. |
10 |
to |
19 |
4 |
4 / 10 = |
0.40 |
|
3. |
20 |
to |
29 |
2 |
2 / 10 = |
0.20 |
|
4. |
30 |
to |
39 |
1 |
1 / 10 = |
0.10 |
|
5. |
40 |
to |
49 |
1 |
1 / 10 = |
0.10 |
n = Sf = 10 Srf = 1.00
![]() One should always round down when determining the class width. True
False
(click one)
One should always round down when determining the class width. True
False
(click one)
Example 4:
Histogram (using data from Example 1) Download Excel Worksheet
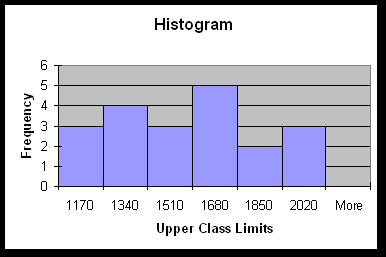
![]() The numbers on the horizontal axis are the midpoints of each class. True
False
(click one)
The numbers on the horizontal axis are the midpoints of each class. True
False
(click one)
Example 5:
Frequency Polygon (using data from Example 1). Download Excel Worksheet
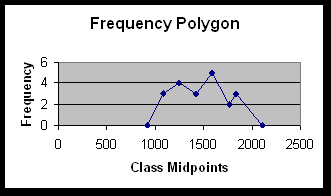
![]() A frequency polygon must begin and end at a frequency of zero. True
False
(click one)
A frequency polygon must begin and end at a frequency of zero. True
False
(click one)
Example 6:
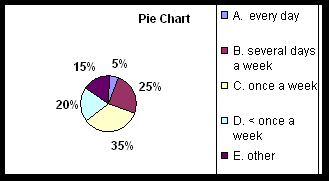
Pie Chart (using data from Example 1). Download Excel Worksheet
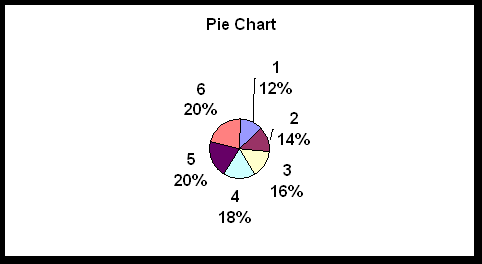
![]() Pie charts must add to 360%. True
False
(click one)
Pie charts must add to 360%. True
False
(click one)
Example 7:
Histogram and Ogive (using data from Example 1). Download Excel Worksheet
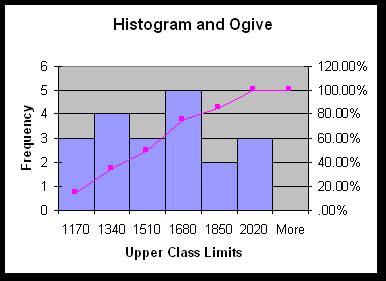
![]() An ogive must show the related histogram at the same time. True
False
(click one)
An ogive must show the related histogram at the same time. True
False
(click one)
Example 8:
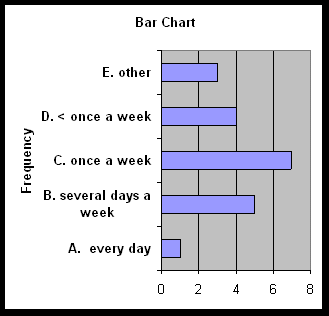
Bar Chart and Pie Chart for Nominal Data. Download Excel Worksheet
The following are results of asking a group of people how often the smoke. Calculated the values necessary to construct a bar chart and pie chart.
|
Category |
f |
| A. every day |
1 |
| B. several days a week |
5 |
| C. once a week |
7 |
| D. < once a week |
4 |
| E. other |
3 |
![]() The bars of a bar chart must be separated by space. True
False
(click one)
The bars of a bar chart must be separated by space. True
False
(click one)
Go on to Excel
and Equations
or
Go back to Lesson 1: Introduction:
or
Go back to Descriptive Graphs: Activities and Assignments
Please reference "BA501 (your last name) Assignment name and number" in the subject line of either below.
E-mail Dr. James V. Pinto at
BA501@mail.cba.nau.edu
or call (928) 523-7356. Use WebMail for attachments.

Copyright 2002 Northern Arizona University
ALL RIGHTS RESERVED