Introduction: Skewed Data Distributions and Employing Histograms
The number of elements assigned to each bucket in Programming Activity #2 varied significantly which led to high load imbalance. An approach to reducing the load imbalance between nodes is to first generate a histogram of the data with a sufficiently large number of buckets, and then assign data ranges to each rank based on the cumulative distribution function of the histogram, where each rank is assigned roughly the same number of elements to sort.
In this exercise, you will histogram the data on Rank 0. Since the data distribution generated on each node is the same, we do not need to create a global histogram of the data.
Figure 3 shows an example of generating a histogram with $b=1000$ bins. From the figure, we observe that the lower bin numbers contain the greatest number of elements. Thus, in Programming Activity #2, the rank assigned the lowest bin numbers had the largest workload.
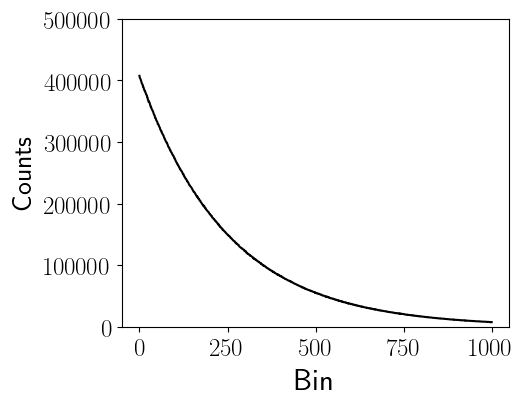
Figure 3: Example histogram of binning the input data into $b=1000$ bins, where $N=10^8$.
Figure 4 shows the cumulative distribution function of Figure 3. The cumulative distribution function at a given bin is simply the addition of counts in the all previous bins including the bin itself (shown in Figure 3), divided by the total number of elements, $N$. The cumulative distribution function allows us to compute how much of the data is contained within bin ranges. For example, from Figure 4 we observe that roughly 50% of the data is found within bin ranges [0, 168). In other words, half of the data is found within only 16.8% of the bins.
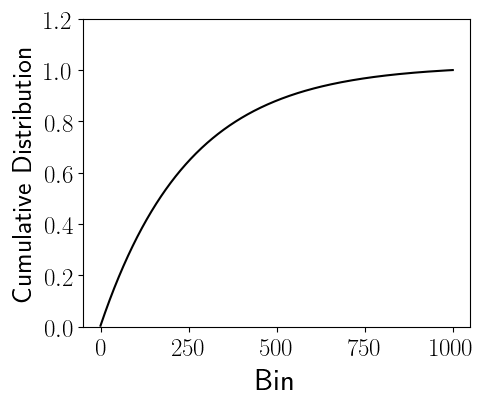
Figure 4: Cumulative Distribution Function of Figure 3.
Figure 5 shows an example partitioning of the data using the data in Figure 3, where $p=4$ process ranks are each assigned roughly 25% of the data elements. However, unlike Programming Assignment #2, the data ranges assigned to each process rank are not the same.
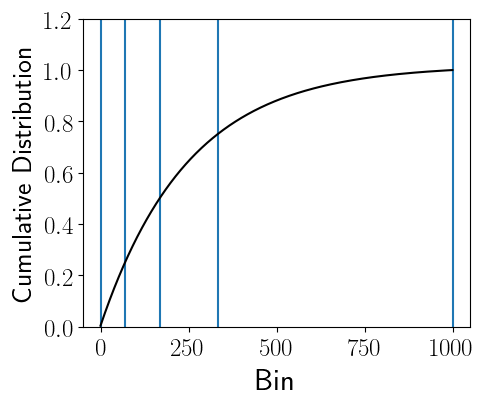
Figure 5: Example partitions using the Cumulative distribution function (Figure 4), where $p=4$; therefore, each rank is assigned roughly 25% of the elements. The bins assigned to the $p=4$ ranks have the following bin ranges: [0,70), [70, 168), [168, 333), and [333, 1000], respectively.
- Q9: Based on the description above, are there any additional overheads to the algorithm?
Programming Activity #3
- Have rank 0 generate a histogram containing some number of bins, $b$, where the number of bins is sufficiently large (i.e., $p \ll b$).
- Using the histogram generated by rank 0, broadcast the minimum and maximum data ranges to each process rank. These data ranges should yield nearly equal numbers of elements assigned to each process rank. Note that you do not need to compute the cumulative distribution function, rather you can use the histogram data to compute the partition boundaries.
- You may reuse the code you used in Programming Assignment #2.
- When computing the data ranges, make sure that the data is computed programmatically. Do not analytically compute the cumulative distribution function for the exponential distribution. Ideally, your program will work with other data distributions, including those found in real-world settings that do not have known analytical solutions to their cumulative distribution functions and require computing the bins numerically. Figure 6 shows an example of a distribution that requires numerically computing the bin ranges.
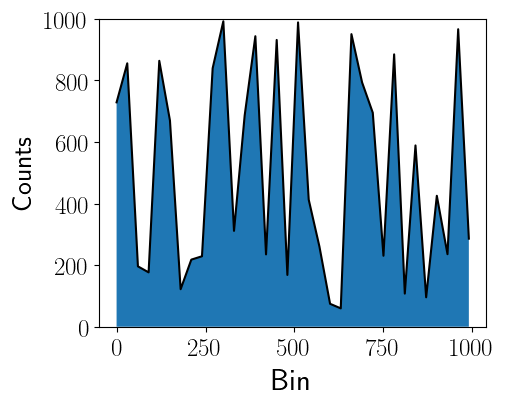
Figure 6: Example real-world data distribution that does not have a known cumulative distribution function.
Complete the table below using the same instructions outlined in Programming Activity #1.
| # of Ranks ($p$) | Total Time (s) | Time to Distribute (s) | Time to Sort (s) | Parallel Speedup | Parallel Efficiency | Global Sum | Job Script Name (*.sh) |
|---|---|---|---|---|---|---|---|
| 1 | |||||||
| 2 | |||||||
| 4 | |||||||
| 8 | |||||||
| 12 | |||||||
| 16 | |||||||
| 20 |
Using the data you collected in your table, answer the following questions. Be sure to refer to specific values in your table when responding to these questions.
- Q10: How does the histogram solution compare to the performance achieved in Programming Activity #2?
- Q11: How does the histogram solution compare to the performance achieved in Programming Activity #1?
- Q12: Do you think all distribution sort implementations (e.g., libraries) based on bucketing should use a histogram?
- Q13: Can you think of a method that can be used to reduce the overhead of the histogram procedure?