Introduction
A fundamental database operation that is used in many data analysis subroutines is range queries. Range queries find all objects within a lower and upper bound in each dimension. In this module, we will implement parallel range queries using the brute force approach and using an indexing data structure, the R-tree. We will compare performance and examine how performance varies using each algorithm.
Student Learning Outcomes
- Understand the scalability of the brute force and R-tree range query algorithms.
- Compare performance of brute force and R-tree range query algorithms.
- Discover how compute-bound and memory-bound algorithms vary in their scalability.
- Understand the impacts of resource allocation on R-tree algorithm performance.
- Based on foundational knowledge, devise a new resource allocation strategy that may improve performance.
- Synthesize the experimental data to assess what may happen when resources are shared by multiple users.
Prerequisites
Some knowledge of the MPI API and familiarity with the SLURM batch scheduler.
MPI Primitives Used
- MPI_Reduce
Files Required
Optional Files
Problem Description
An illustrative example of using range queries in the context of astronomy is as follows. Astronomers will often cross-match catalogs of data based on the location in the sky given in units of longitude and latitude, which are coordinates called Right Ascension (RA) and Declination (Dec). The range of the former is [0, 360] and the latter is [-90, 90].
Consider a range query that finds all objects that have an RA in the range [150, 190] and Dec in the range [0, 30]. Figure 1 plots a heatmap of the data (asteroid measurements) in this database (there are 5 million objects/asteroids), showing the Right Ascension vs. Declination. A red rectangle outlines the abovementioned range query. Figure 2 shows the corresponding scatterplot of the data around that range, where you can observe that the data space is highly populated with objects.
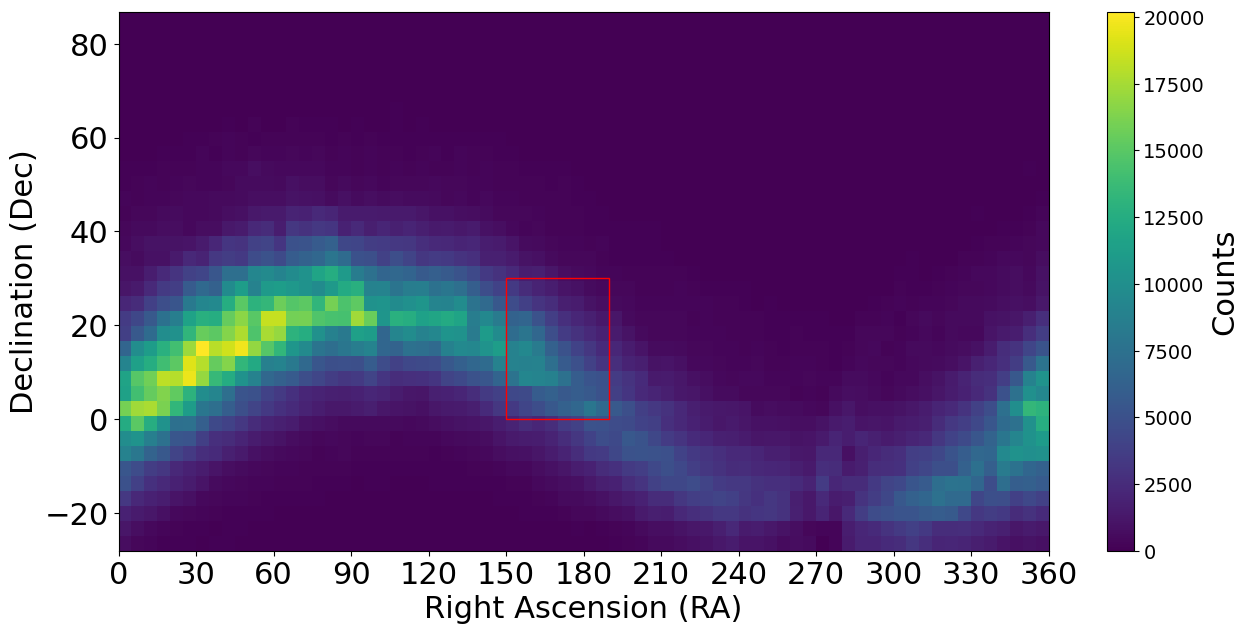
Figure 1: Example plot of data in an astronomical database of 5 million asteroid positions. The rectangle shows a range query with RA in the range 150-190 and Dec in the range 0-30.

Figure 2: A scatterplot showing the same range query illustrated in Figure 1.
Let $|D|$ be the total number of asteroids, and $d$ be the number of dimensions. In the astronomy database example, $d=2$. To compute a single range query, each data point must be compared to the ranges in each dimension to determine if the point lies within the ranges. Therefore, using a brute force approach, the time complexity for a single range query is $O(|D|)$.
Programming Activity #1
Write a distributed-memory range query algorithm using the brute force method.
-
Use and modify the starter file:
range_query_starter.c. -
Compile all programs with the -O3 optimization flag.
-
Use a single node.
-
Use the exclusive flag for all experiments so that your results are not polluted by other users running on the node.
-
The starter file will import the dataset, $D$, at each rank.
-
The starter file will generate query datasets at each rank.
-
The input dataset, $D$, will be replicated across all ranks.
-
The query dataset, $Q$, will assign $\lfloor |Q|/p\rfloor$ queries to each rank. Since we take the floor of $|Q|/p$, then we do not need to consider the case where there are “leftover” queries to search; therefore, we may search slightly fewer than $|Q|$ queries if $|Q|~mod~p~!=0$.
-
The query dataset that is generated varies between ranks.
-
The value of a data point in the dataset in dimension $j$ denoted as $p_j \in D$ lies within the range of dimension $j$ if $r_j^{lower}\leq p_j\leq r_j^{upper}$, where $r_j^{lower}$ and $r_j^{upper}$ are the lower and upper bounds of the range in dimension $j$. Make sure to check the logic of your comparison operators.
-
The total size of $D$ and $Q$ will be given on the command line.
-
Q1: Excluding the fact that the algorithm is brute force, what is one potential inefficiency described in the programming activity?
Validation
- You may want to make your own example dataset to test that the logic of your range queries is correct.
- For each range query, you will store the number of hits for that query in an array (i.e., the number of data points within the range). After timing the computation, you will add up the values of this array to compute the local sum, then perform a reduction to compute the global sum at rank 0 (be sure to use a suitable data type for this value in your program). Output the global sum.
- The global sum for $p=20$ is 96,050,298.
In your report, include tables with the following information for executions with $p=1, 4, 8, 12, 16, 20$ process ranks, with $|D|=5000000$ and $|Q|=50000$. You will create a table showing the total response time, speedup, parallel efficiency, and the global sum for validation purposes. The total response time is the time needed to compute the range queries on the longest executing rank. Use a reduction to compute the total response time.
Include all job scripts in the submitted archive. The job script may be the same for all executions. Use a single dedicated node for all experiments. An example template table is given below.
Table 1: Total response time, speedup, and parallel efficiency (one node).
| # of Ranks ($p$) | Time (s) | Speedup | Parallel Efficiency | Global Sum | Job Script Name (*.sh) |
|---|---|---|---|---|---|
| 1 | |||||
| 4 | |||||
| 8 | |||||
| 12 | |||||
| 16 | |||||
| 20 |
Using the data you collected in your table, answer the following questions. Be sure to refer to specific values in your table when responding to these questions.
- Q2: Describe the performance of the brute force algorithm, does it scale well? Explain.